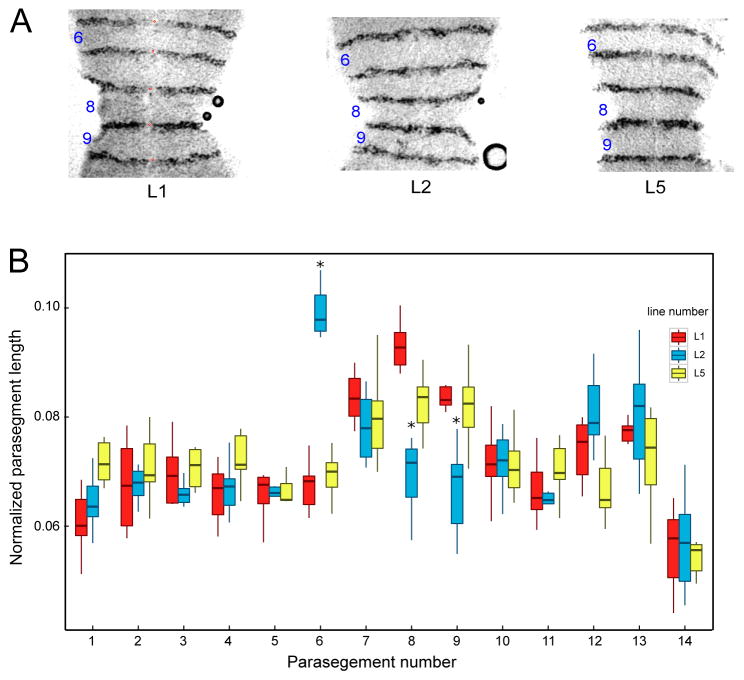
Figure 3.
Normalized parasegment lengths. A) Images of En expression in parasegments 6–9 of stage 10 dissected embryos from the three lines, as indicated. The red dots mark the anterior of the En stripes demarcating the parasegment, These fiducial marks were used to calculate the length of each parasegment. (B) shows the quantification of the normalized parasegment distance for each line. Significant differences of one line from the other two are marked with an asterisk on the boxplot. Outliers in boxplot are not shown.

