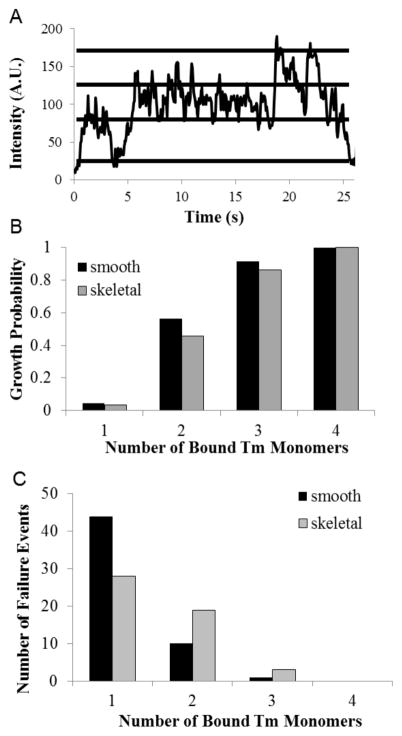
Figure 3. Detection of Single Molecule Binding Events.
(A) Representative plot of the intensity variation that occurs within a single binding event over time for a tropomyosin binding event. In this example the quantal variation is ~45 units. Stepwise intensity variations were used to determine the maximum number of tropomyosin monomers bound for each failure and elongation event. (B) The probability that tropomyosin chain elongation will occur following the binding of a given number of tropomyosin monomers. (C) Histograms of the number of failure events that occur when a given number of tropomyosin monomers bind successively to actin. Note the exponential decrease in failure events as more tropomyosin molecules bind.

