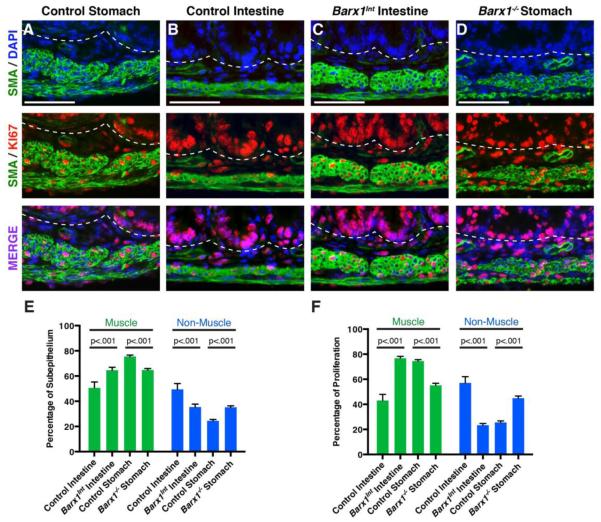
Figure 5. Increased muscle cell proliferation in Barx1Int intestines.
(A-D) Fluorescence IHC of E17.5 control and mutant stomachs and intestines (n=3 each) stained simultaneously for SMA-A and DAPI (top), SMA-A and Ki67 (middle), and merged images (bottom). The border between epithelium and mesenchyme is marked with dashed lines. Scale bars, 50 μm. (E) Counts for DAPI+ and Ki67+ cells in sub-epithelial muscle (SMA+) and non-muscle (SMA−) regions. Six separate areas were analyzed for each indicated tissue sample and genotype (n=3 each). Sub-epithelial composition was determined by comparing the ratio of muscle and non-muscle cells. (F) Fraction of proliferating cells, determined by counting Ki67+ cells in muscle and non-muscle compartments. Bars represent mean + SEM of biologic replicates. Comparisons were made between the same regions of the proximal intestine in wild-type and mutant mice.

