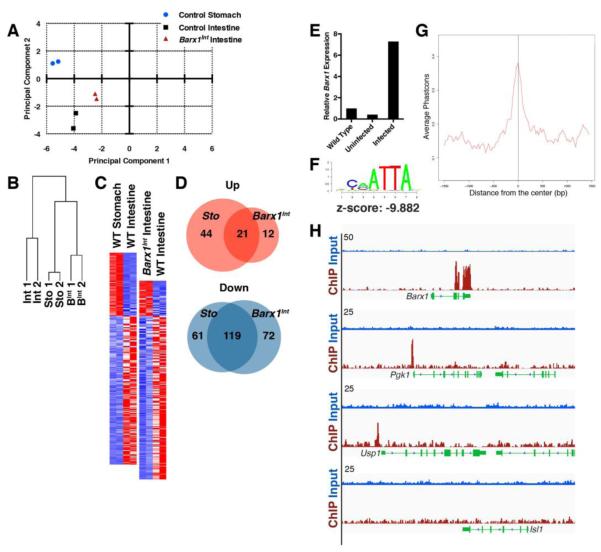
Figure 6. Transcriptional control of stomach mesenchyme.
(A-B) Principal component analysis (A) and unsupervised hierarchical clustering (B) of gene expression profiles indicates reproducible data from replicate samples and similarities between cultured wild-type stomach and Barx1Int mesenchyme. (C) Heatmaps of mRNAs altered >2-fold in wild-type (WT) stomachs (left) and Barx1Int intestines (right), both compared to WT intestines. Red, elevated expression; blue, reduced expression. (D) Venn diagrams representing transcripts expressed at higher (red) and lower (blue) levels in control stomachs and Barx1Int intestines compared to WT intestines. (E) qRT-PCR evidence for expression of Flag-tagged Barx1 in immortalized embryonic stomach mesenchymal cells. (F) Significant enrichment of the BARX1 consensus motif at occupied sites. (G) Graph showing evolutionary conservation of BARX1 binding sites in 8 mammalian species. (H) Integrated Genome Viewer traces of input (blue) and BARX1 ChIP (crimson) fragment reads (tag counts are represented on the y-axis) at 3 significant binding sites (top 3 examples), including the Barx1 gene, and in the Isl1 locus (bottom example).

