Figure 5.

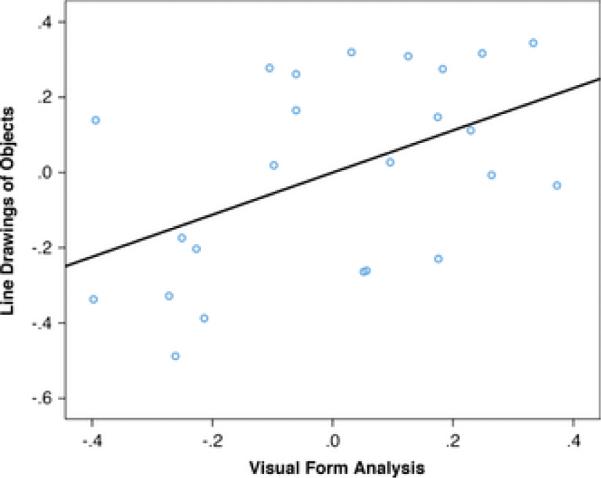
Experiment 3: Partial regression plot showing the relationship between children's scores on the visual form analysis task and their scores on the line drawing task depicting objects, after controlling for age.

Experiment 3: Partial regression plot showing the relationship between children's scores on the visual form analysis task and their scores on the line drawing task depicting objects, after controlling for age.