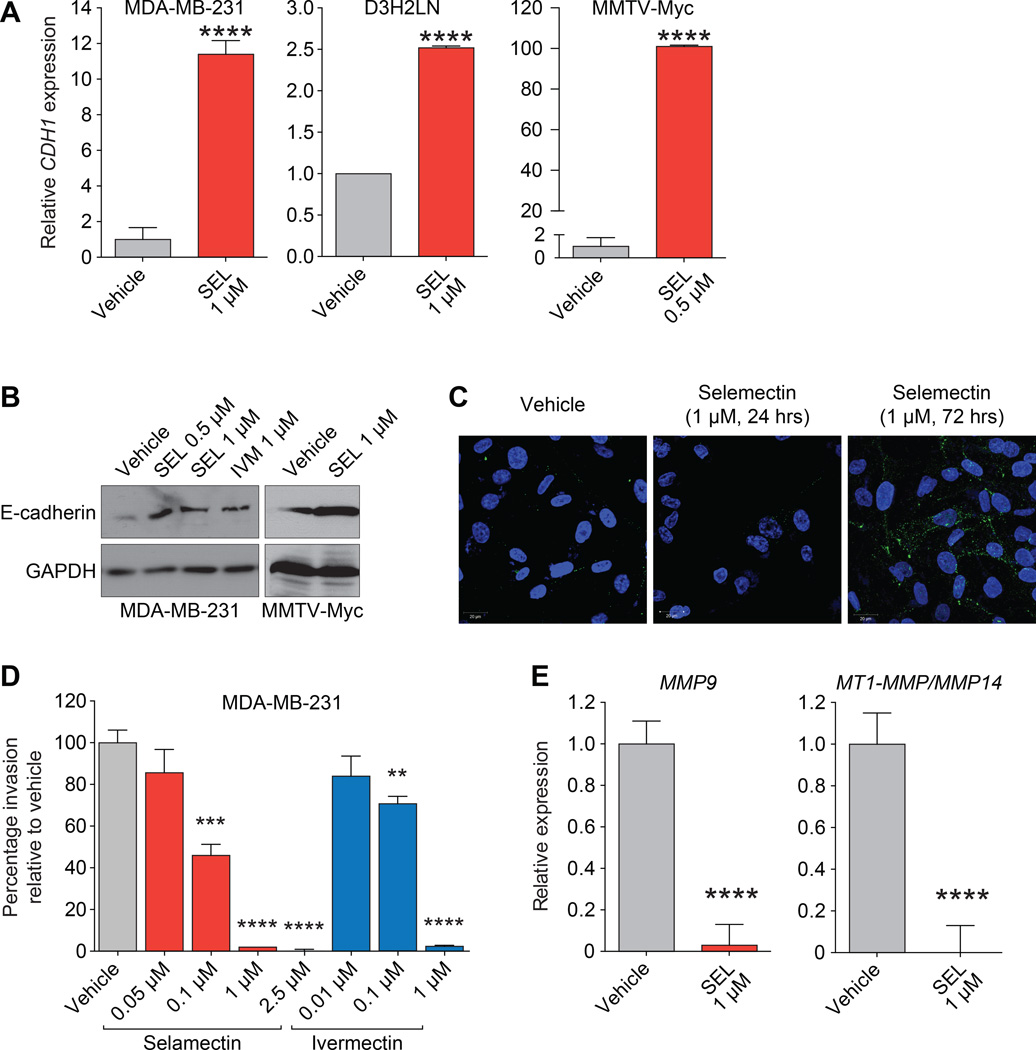
Figure 3. Treatment with selamectin or ivermectin leads to upregulation of CDH1 expression in TNBC.
A, qPCR of CDH1 mRNA in MDA-MB-231 (P < 0.0001), D3H2LN (P < 0.0001), and MMTV-Myc (P < 0.0001) cell lines following treatment with selamectin (5 days) as indicated.
B, MDA-MB-231 and MMTV-Myc cells were treated with selamectin or ivermectin as indicated (5 days) and subjected to immunoblot analysis to determine expression of E-cadherin protein.
C, MDA-MB-231 cells were treated with selamectin as indicated and subjected to immunofluorescence analysis to determine expression of E-cadherin protein.
D, MDA-MB-231 cells were plated in transwell invasion filters and treated with indicated concentrations of selamectin or ivermectin. Shown are percentage of cells that traversed Matrigel-coated filters relative to vehicle control (SEL: 0.1 µM, P = 0.0003; SEL: 1 µM, P < 0.0001; 2.5 µM, P < 0.0001. IVM: 0.1 µM, P = 0.0019; SEL: 1 µM, P < 0.0001).
E, qPCR of MMP9 (leftP < 0.0001) and MT1-MMP/MMP14 (rightP < 0.0001) of MDA-MB-231 cells in 3D culture following treatment with selamectin (24 hrs) as indicated.
Error bars represent mean ± SD. P, unpaired t-test.

