
Fig. 1.
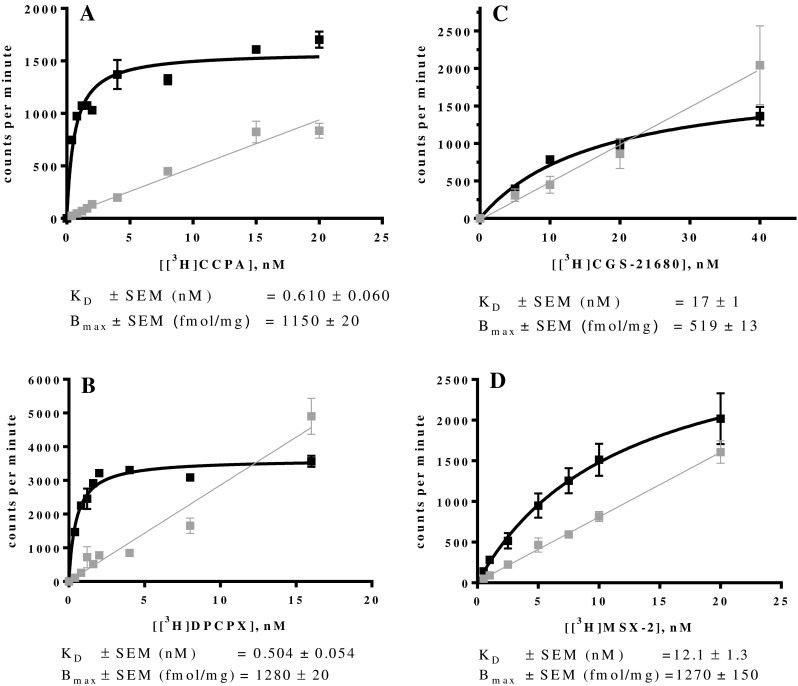
Saturation binding assays at ARs stably expressed in recombinant CHO cells: a mA1AR using [3H]CCPA; b mA1AR using [3H]DPCPX; c mA2AAR using [3H]CGS-21680; d mA2AAR using [3H]MSX-2. Data are means of three independent saturation assays each performed in duplicates. Curves represent specific binding and gray lines represent non-specific binding. Curves and lines were obtained by plotting the counts per minute against increasing concentrations of the radioligand