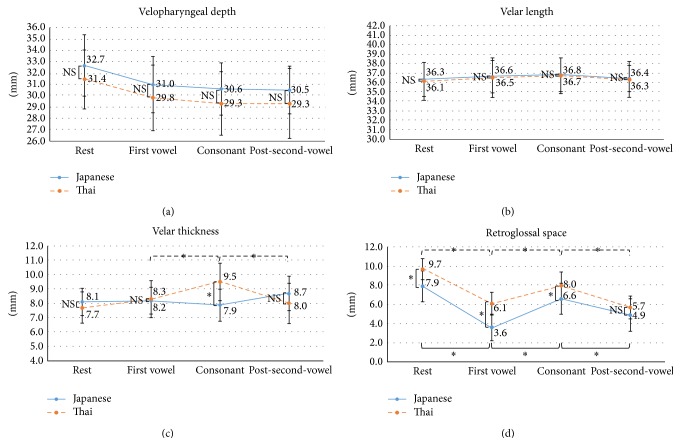
Figure 5.
Time-to-time changes in the velopharyngeal structures of Japanese and Thai subjects. The graphs show the dimensional changes in each area of interest: velopharyngeal depth (a), velar length (b), velar thickness (c), and retroglossal space (d). The x-axis shows the measurement stages and the y-axis shows the distance in millimeters. ∗ p < 0.05; NS: not significant.

