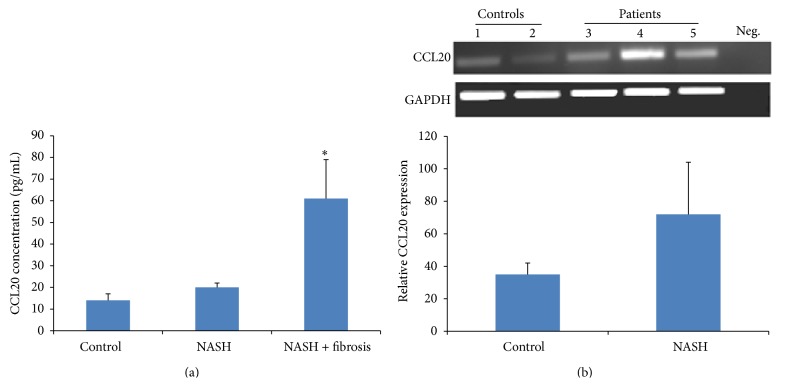
Figure 4.
CCL20 expression. (a) CCL20 concentrations in pg/mL in the serum of control subjects and NASH patients. CCL20 was measured by ELISA as described in Section 2. Data represent mean ± SEM in triplicate (ELISA) from 39 different donors/sera of NASH patients. The levels of CCL20 were significantly increased in NASH patients and NASH patients with fibrosis compared with control subjects, with P = 0.0332 and P = 0.0001, respectively. (b) On the mRNA level, CCL20 mRNA is not significantly increased in NASH patients with P = 0.1208 (* P < 0.05).

