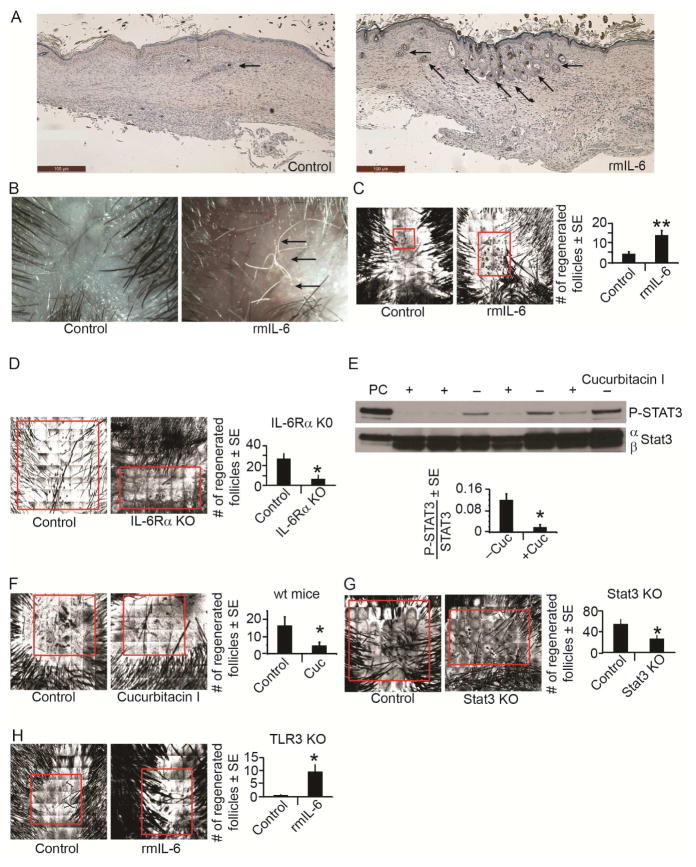
Figure 3. IL-6 and pSTAT3 mediate TLR3 effects on WIHN.
A) Cross-sectional H&E histology of healed scar at WD22 after a single injection of IL-6 (25ng) or PBS control at WD7. Regenerated hair follicles are marked with arrows. Scale bar=100 μm.
B) Regenerated hair shafts (white, arrows) at ~WD58-62 as visualized by dissecting microscope.
C) WIHN in wt mice after single dose of IL-6 (25ng) compared to PBS control as measured by CSLM; n = 30 mice.
D) WIHN in keratinocyte-specific knockout of IL-6Receptorα compared to control mice measured by CSLM; n = 3–6 mice.
E) P-Stat 3 levels in the presence of cucurbitacin I (+) compared to control (−) in wt mice as measured by western blot and normalized to Stat3. PC = P-STAT3 positive control cell lysate.
F) WIHN levels in wt mice after cucurbitacin I (2mg/kg) or control as measured by CSLM; n = 10–14 mice.
G) WIHN in keratinocyte-specific knockout of Stat3 compared to control mice measured by CSLM; n = 10–15 mice.
H) WIHN in TLR3 KO mice after single dose of rmIL-6 (500ng) compared to PBS control measured by CSLM; n = 8–10 mice.
*p < 0.05 by Student’s T-test or Single Factor ANOVA.

