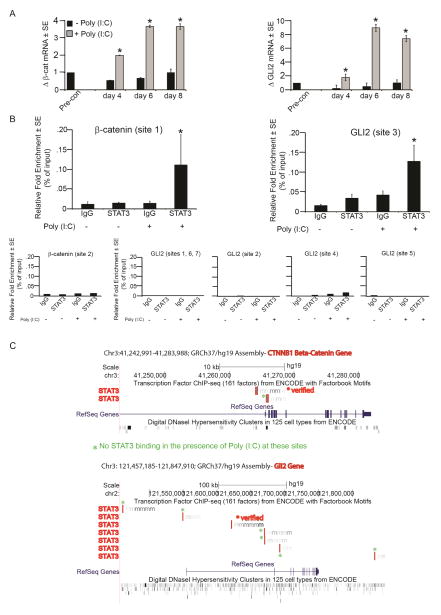
Figure 6. TLR3 activation increases STAT3 occupancy of β-catenin and GLI2 promoters.
A) Mean fold change in β-catenin and GLI2 mRNA after continuous exposure to poly (I:C) at indicated time points as determined by qRT-PCR and normalized to housekeeping gene, RPLP0. Fold changes in mRNA expression relative to pre-confluent keratinocytes.
B) Relative fold enrichment of STAT3 occupation of β-catenin and GLI2 promoter sites after poly (I:C) treatment of keratinocytes. Negative binding sites also included below. Data representative of 5 independent experiments, p < 0.05.
C) Graphical representation of verified positive and negative STAT3 binding on β-catenin and GLI2 after poly (I:C) treatment of keratinocytes. Images obtained from ENCODE database.
*p < 0.05 by Student’s T-test or Single Factor ANOVA.

