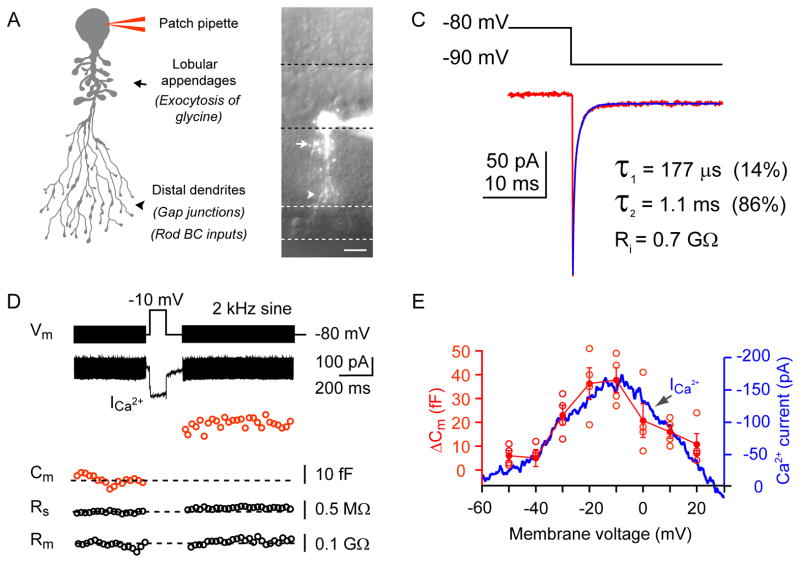
Figure 1. Capacitance measurements from mouse AII amacrine cells.
A: Schematic diagram of an AII amacrine cell (AII-AC) showing the thick primary dendrite, its lobular appendages (site of glycinergic active zones) and the distal arboreal dendrites (site of rod bipolar cell input and gap junctions). B: Fluorescence image of an AII-AC in a mouse retinal slice. The cell was filled with Alexa fluor-488 (100 μM) via a patch pipette on the soma. The dashed lines demarcate the boundaries of different retinal layers. Scale bar = 10 μm. C: The AII-AC shows a bi-exponential capacitative current decay (fit = blue curve) and a steady-state current during a 10 mV hyperpolarizing voltage step. The time constants are shown as well as the input resistance (Ri), which is calculated from the steady-state current. D: Depolarization-evoked exocytosis from a mouse AII-AC. A membrane capacitance (Cm) change was evoked by a depolarizing step. Experiments were conducted at near physiological temperature (~30°C). The stimulus protocol was composed of three segments: a 2 kHz sinusoidal voltage of 30 mV peak-to-peak in amplitude superposed on the holding potential of −80 mV before and after a 100 ms depolarizing step from −80 mV to −10 mV, which evoked a Ca2+ current. The 2 kHz sine wave was used to measure changes in Cm that reflect the exocytosis of synaptic vesicles. Note the absence of significant changes in series resistance (Rs) and membrane resistance (Rm). E: Voltage dependence of Ca2+ current and membrane capacitance change (ΔCm) in AII-ACs. The ΔCm was evoked by single depolarizing pulse of 200 ms duration, from −80 mV to various membrane potentials (n=5; with temperature at ~28°C). Mean and SEM values are mark ed in solid red circles, whereas open red circles denote individual values. The Ca2+ current was evoked by a voltage ramp from −60 to +30 mV for 100 ms (blue trace; average of 5 cells). The Ca2+ currents and ΔCm are highly correlated for the different membrane potentials.

