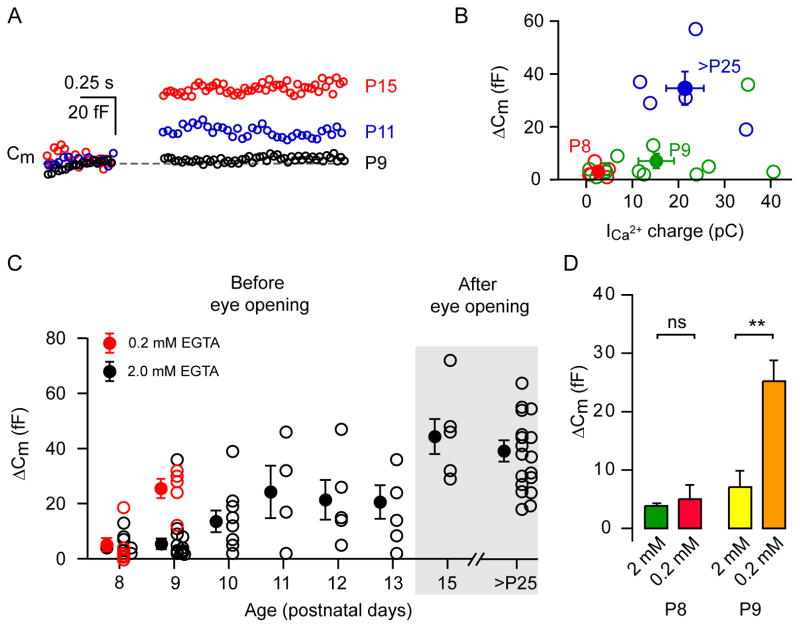
Figure 6. Developmental changes in exocytosis at AII amacrine cell synapses.
A: Typical examples of average depolarization-evoked ΔCm for a 100 ms pulse from −80 to −10 mV (given at the arrow) from AII-AC at three different postnatal ages (P9, P11, and P15; average of 2 to 3 traces). B: The graph shows ΔCm against calcium influx (as Ca2+ charge) at three different age groups (P8, P9 and >P25) indicated in different colors. Filled circles denote the mean ± SEM and open circles denote individual cells. C: Graph of individual ΔCm from different cells from postnatal day P8 to >P25 animals. Filled circles denote the mean ± SEM and open circles denote individual cells. This experiment was performed at ~33°C with 1.15 mM external Ca2+. Recordings with 2 mM EGTA in the pipette solution are shown in black, whereas recordings with 0.2 mM EGTA in red. D: Bar graph showing ΔCm as mean ± SEM from P8 and P9 animals with 2.0 and 0.2 mM EGTA. Statistical significance was tested with an unpaired t-test denoted by asterisks.

