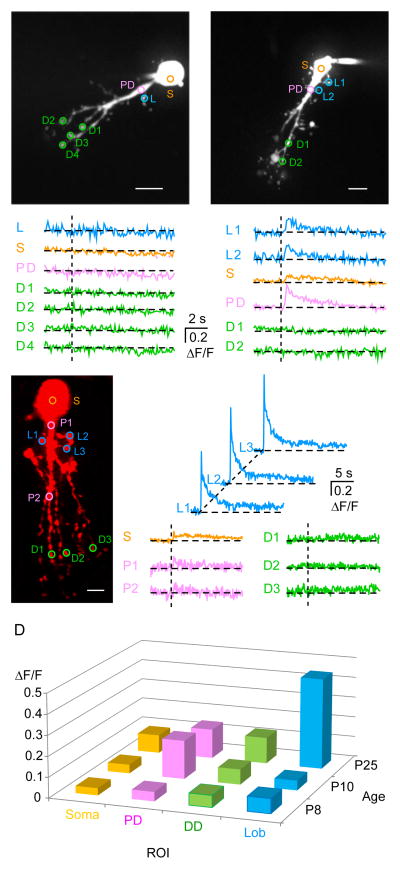
Figure 7. Calcium imaging in developing AII amacrine cells.
A, B, C: The z-projection of AII cells (P8, P10 & P25) imaged with a two-laser spinning disc confocal microscope. The cell was filled with Alexa Fluor-594. Ca2+ transients were computed as the change in green fluorescence of the dye Oregon Green 488 BAPTA-1 (100 μM) from the region of interests (ROIs) marked in circles of different colors. Scale bar: 10 μm. Traces showing ΔF/F from the ROIs outlined in the z-projection for a single depolarizing pulse (from −80 mV to −10 mV for 100 ms). Vertical dashed lines represent the stimulus onset. At P8, no calcium influx was observed at any of the ROIs. At P10, small Ca2+ transients were observed in the soma (s), proximal dendrites (PD), and lobular appendages (L), but not the distal dendrites (D). At P25, large Ca2+ transients were observed in the lobular appendages (L), and small Ca2+ transients were observed in the soma (s) and proximal dendrites (PD). D: A 3-D bar graph showing the mean of ΔF/F from ROIs of the soma, proximal dendrites (PD), distal dendrites (DD), and lobules (Lob). Other analyzed parameters are shown in Supplementary Figure S3.

