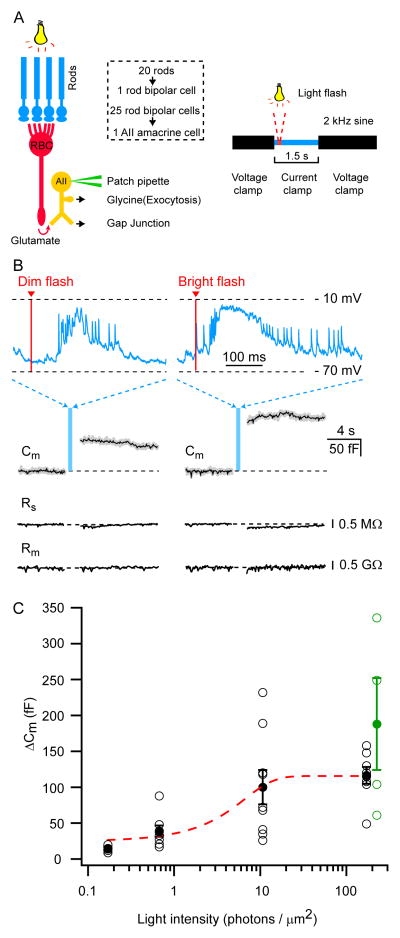
Figure 8. Light-evoked exocytosis in AII-amacrine cells.
A: Schematic diagram showing the convergence of the rod circuitry and the experimental setup. Several rod photoreceptors synapse onto one rod bipolar cell (RBC) and several RBCs synapse onto one AII-AC. The AII-AC was patched at the soma and held at −60 mV in the whole-cell voltage-clamp configuration. The stimulus protocol was composed of three segments: 1) a 2 kHz sinusoidal voltage of 15 mV peak-to-peak in amplitude superposed on the holding potential (−60 mV), 2) a current-clamp segment (1.5 s duration) during which a light flash of varying intensity was delivered (0.17, 0.67, 1.33, 10.67,170.67 photons/μm2, respectively), and 3) a 2 kHz sinusoidal voltage of 15 mV peak-to-peak in amplitude superposed on the holding potential (−60 mV) to measure Cm changes.
B: Retinal slices from dark-adapted mice were used to record light responses and the Cm was measured before and after the light response. Top traces: Example of a light-evoked voltage response of an AII-AC to a dim and bright light flash (0.67 and 170.67 photons/μm2). The red bar indicates the timing of the light stimulus onset. Bottom traces: The Cm traces are responses to a single light stimulus (dim or bright) yielding ΔCm of 88 fF and 158 fF, respectively. The superimposed black trace is the average value of the Cm data points.
C: Summary of ΔCm evoked by various light intensities from 17 AII-ACs. Black circles with error bars represent the mean ± SEM. The open circles are individual data points. The data was fit with a sigmoid function: base + max/(1 + exp((x0 − x)/rate)). The amount of exocytosis varies as a graded function of the light intensity and saturates at bright light intensities. Green circles are ΔCm changes from experiments conducted with a Cs-based internal solution in the pipette and evoked by the voltage response from a light-stimulus of 170.7 photons/μm2 (bright flash). There was no significant difference in ΔCm changes between Cs-based and K-based experiments (p value: 0.965).

