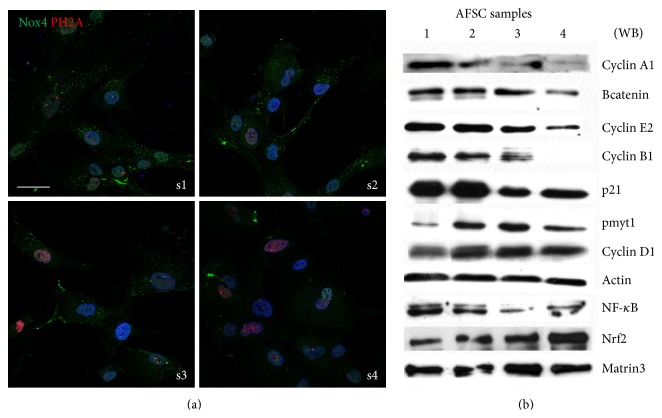
Figure 4.
AFSC samples heterogeneity in DNA damage, senescence, and cell cycle. (a) Representative images showing superimposing between DAPI (blue), Nox4 (green), and PH2A (red) signals of samples 1 to 4 of AFSC. (b) Representative images of total lysates of AFSC samples 1–4 separated by SDS-PAGE. Western blot was then performed with the indicated antibodies. Actin detection was performed in order to show the amount of protein loaded in each line. The analysis for NFκB and Nrf2 was performed on nuclear lysates and matrin3 detection was performed in order to show the amount of nuclear protein loaded in each line. Presented data are representative of three independent experiments.

