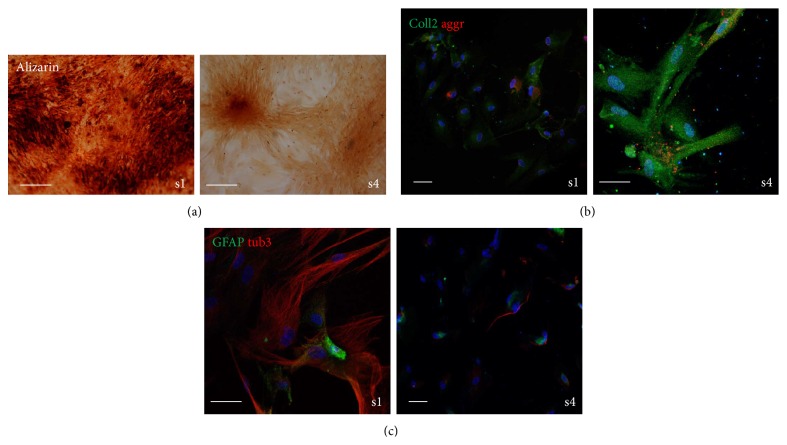
Figure 6.
Effect of donor heterogeneity on differentiation potential. (a) Representative images showing staining with alizarin red of AFSC samples 1 and 4 after three weeks of culture in osteogenic medium. (b) Representative images showing superimposing between DAPI (blue), collagen II (green), and aggrecan (red) signals of AFSC samples 1–4 after three weeks of culture in chondrogenic medium. (c) Representative images showing superimposing between DAPI (blue), GFAP (green), and βtubulin III (red) signals of AFSC samples 1 and 4 after three weeks of culture in neurogenic medium. Scale bar: 10 μm.

