Figure 4.

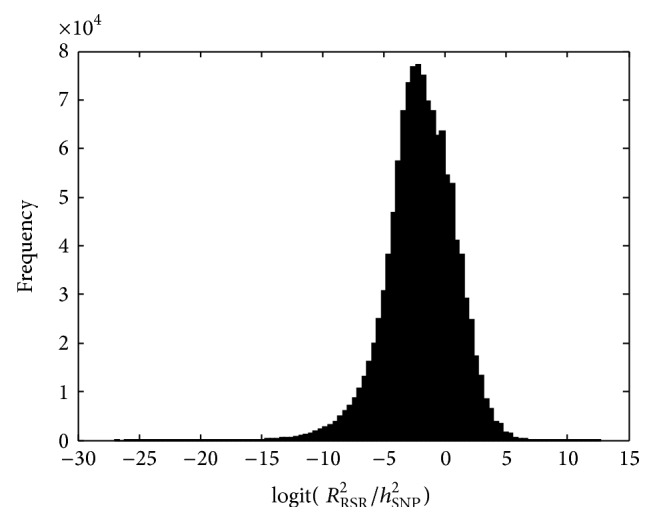
Histogram of logit(R RSR 2/h SNP 2) for 21 runs of simulated data, for different values of N, P, f C, and h 2, excluding observations for which R RSR 2 ≥ h 2.

Histogram of logit(R RSR 2/h SNP 2) for 21 runs of simulated data, for different values of N, P, f C, and h 2, excluding observations for which R RSR 2 ≥ h 2.