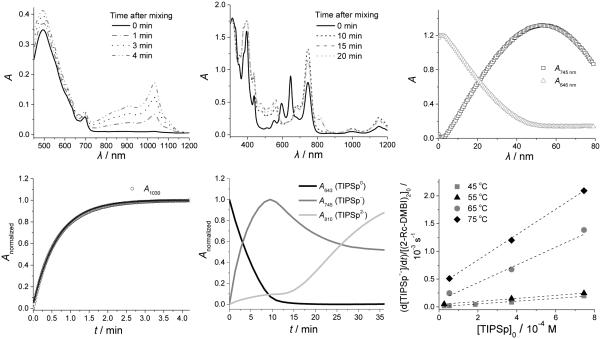
Figure 6.
Representative kinetic data. Left top: UV-vis-NIR spectra of a solution of PCBM (3.7 × 10⁻⁴ M) and (2-Cyc-DMBI)2 (1.3 × 10⁻⁵ M) in chlorobenzene at various times after mixing. Left bottom: corresponding plot of absorbance at 1030 nm versus time (solid line is fit to a first-order expression). Center top: UV-vis-NIR spectra of a solution of TIPSp (4 × 10⁻⁴ M) and (2-Fc-DMBI)2 (4 × 10⁻⁴ M) in chlorobenzene. Center bottom: corresponding plots of absorbances at 643, 745, and 810 nm versus time. Right top: Absorbance at 745 nm vs. time for the reaction of TIPSp (7.4 ×10⁻⁴ M) and (2-Rc-DMBI)2 (5.3 × 10⁻⁵ M) at 55 °C. Right bottom: initial rate of reaction of (2-Rc-DMBI)2 and PCBM divided by the initial concentration of dimer versus the initial concentration of acceptor TIPSp. The linear fits at different temperature with non-zero intercept indicate the rate can be expressed as a sum of two mechanisms, where the intercept is the zero-order rate constant, and slope is the first-order rate constant.

