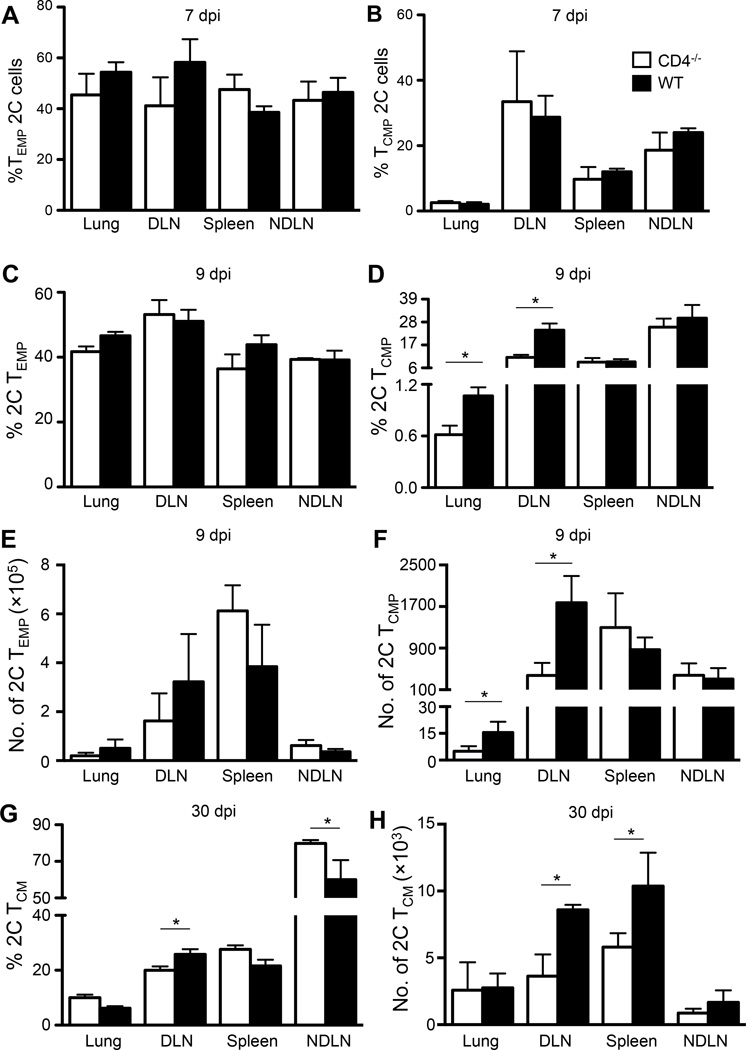
FIGURE 2.
Memory CD8 T cell development differs in WT and CD4−/− mice. The experimental procedures were the same as in Fig. 1A. (A–B) Percentage of TEMP (CD27hi CD62Llo KLRG1lo) 2C cells (A) and TCMP (CD27hi CD62Lhi KLRG1lo) 2C cells (B) in the indicated organs in CD4−/− and WT mice at 7 dpi. (C–D) Percentage of 2C TEMP (CD27hi CD62Llo KLRG1lo) cells (C) and 2C TCMP (CD27hi CD62Lhi KLRG1lo) cells (D) in the indicated organs in CD4−/− and WT mice at 9 dpi. (E–F) Absolute numbers of 2C TEMP cells (E) and 2C TCMP cells (F) in the indicated organs in CD4−/− and WT mice at 9 dpi. (G-H) Percentage (G) and number (H) of 2C TCM (CD62Lhi) cells in the indicated organs in CD4−/− and WT mice at 30 dpi. Error bars: SEM from 4 mice per group from one of two experiments. * P<0.05.

