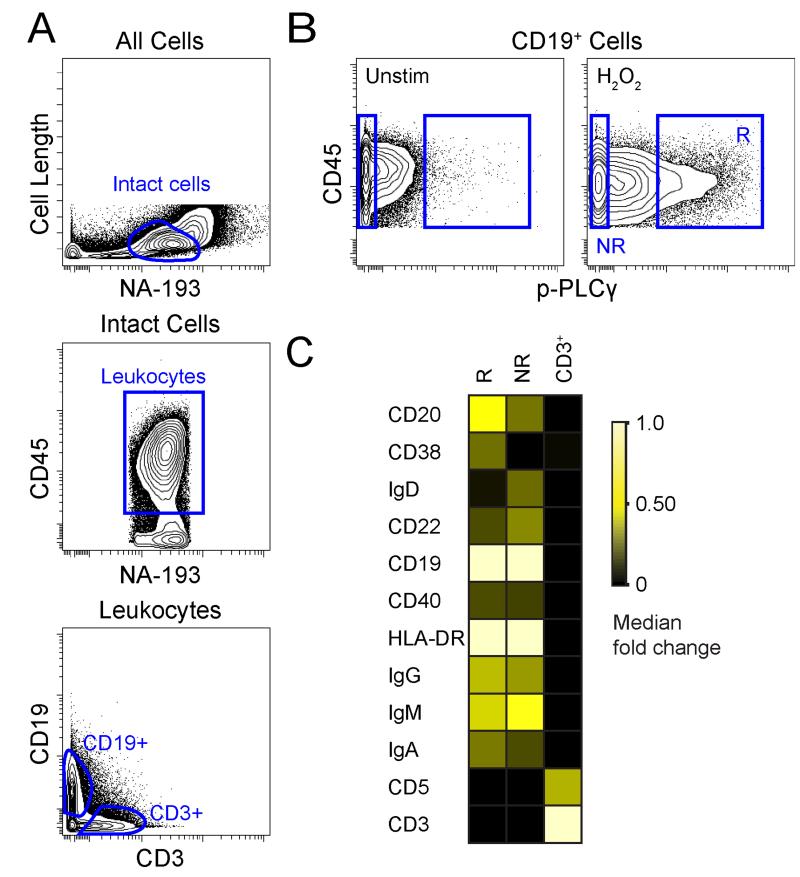
Figure 2. Mass Cytometry Revealed H2O2 ‘Responder’ Population as CD20hi, CD38+, and IgD−.
(A) Contour plots show gating for CD19+ B cells and CD3+ T cells in human tonsil. (B) Contour plots show p-PLCγ in CD19+ tonsil B cells left unstimulated or stimulated by 3.3 mM H2O2 for 4 minutes. Cells that were sensitive to H2O2 stimulation were labeled responder (R) cells and contrasted with non-responder cells (NR). (C) Heat map shows the median fold change CD20 and CD38 in CD3+ T cells, R, and NR subsets.

