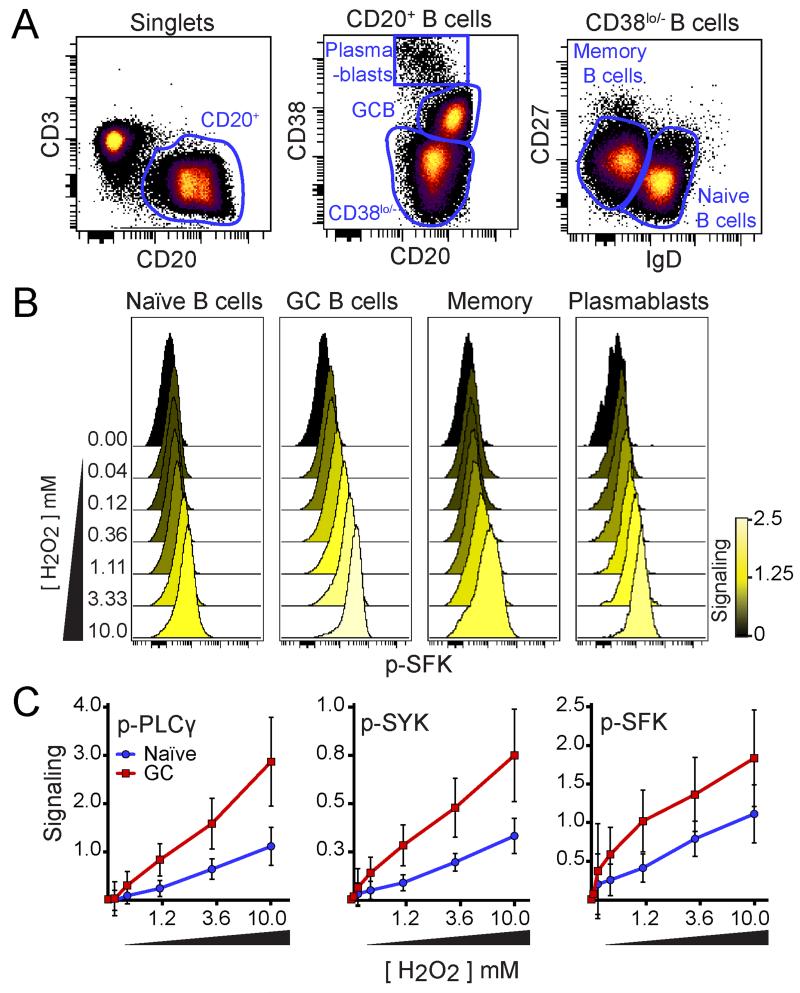
Figure 3. GC B cells were hypersensitive to H2O2.
(A) Density dot plots show gating for identification of plasmablasts, GC B cells, memory B cells, and naïve B cells in human tonsils. (B) Histogram overlays show p-SFK in each B cell population (shown in A) following 2 minutes of 3.3 mM of H2O2 (n=3, representative data shown). Color denotes median fold change in p-SFK expression compared to unstimulated (0 mM of H2O2). (C) Plots illustrate the median fold change in p-PLCγ, p-SYK, and p-SRC in H2O2-stimulated conditions compared to the unstimulated condition (arcsinh scale). Each point represents the average of three individual tonsil specimens (n=3) stimulated for 2 minutes with the indicated concentration of H2O2, except for the 0.04 mM and 0.12 mM H2O2 stimulated conditions (where n=2). Red squares represent GC B cells and blue circles represent naïve B cells. Error bars denote the standard deviation for each point.

