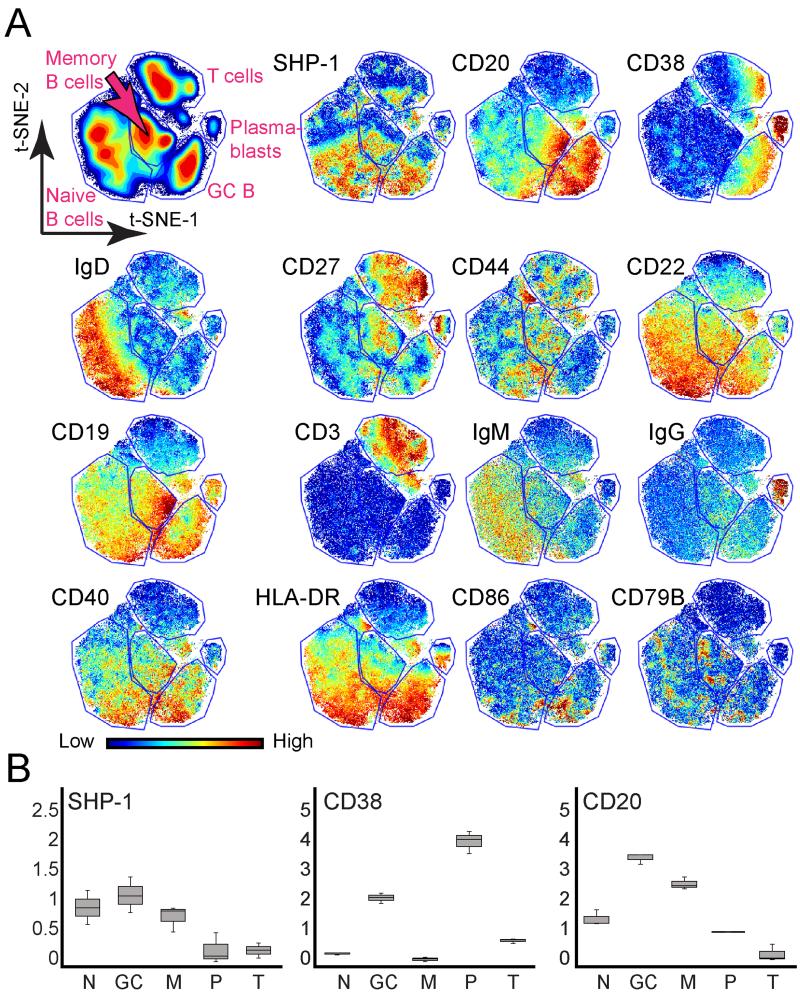
Figure 4. SHP-1 expression was heterogeneous within B cell populations.
viSNE maps show CD45+ leukocytes arranged based on marker expression profiles (see gating in Fig. 2A). Color denotes protein expression, as indicated. (A) Gates were drawn around the main populations identified by viSNE, using protein expression to identify each population. CD19+ B cells were subdivided into naïve B cells (CD38−CD27−IgD+), GC B cells (CD20hiCD38+), memory B cells (CD38−CD27+IgD−), and plasmablasts (CD20−CD38hi) and compared to CD3+ T cells. One representative tonsil of four analyzed is shown. (B) Box and Whisker plots illustrate expression of SHP-1, CD38, and CD20 proteins across three tonsil specimens for naïve B cells, GC=germinal center B cells, M=memory B cells, P=plasmablasts, and T= T cells. Median of each marker is indicated by a black line. Bars denote the minimum and maximum observed MFI of each marker.

