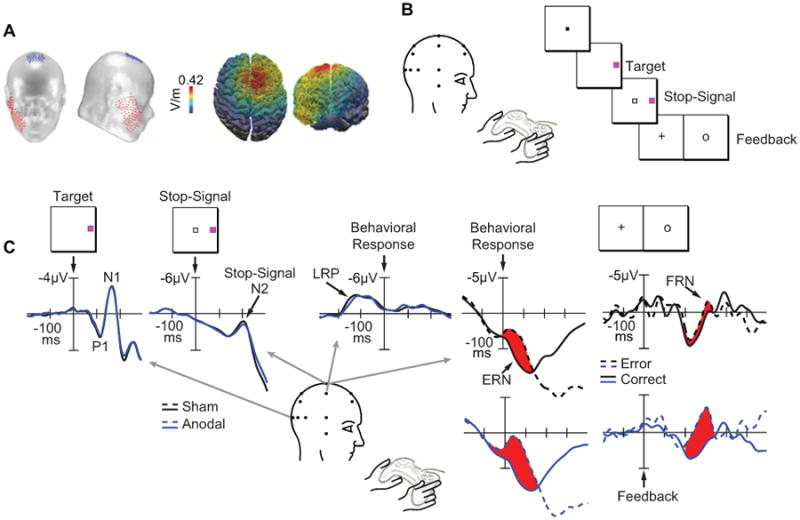
Figure 1.

A, Schematic of a typical transcranial direct-current stimulation (tDCS) montage using one anodal electrode (19.25 cm2, red) and one cathodal electrode (52 cm2, blue). A computational model showing the distribution of current flow during anodal tDCS over the medial-frontal cortex (i.e., site FCz of the International 10-20 System) paired with a cathodal electrode over the right cheek projected on top and front views of a 3D reconstruction of the cortical surface. B, The target discrimination task with stop signals requiring subjects to report the color of the target by pressing one of two buttons on a handheld gamepad unless a stop signal appeared. C, Target locked ERPs from correct, no-stop trials shown at lateral occipitotemporal electrodes (OL/OR) contralateral (dotted) to target location across sham (black) or anodal (blue) conditions. Labels show the P1 and N1 components. Stop signal locked ERPs from correct, stop trials shown at the central midline electrode (Cz) across sham (black) and anodal (blue) conditions. The arrow shows the stop signal N2 component. Response locked ERP difference waves (contralateral minus ipsilateral with respect to response hand) from correct, no-stop trials shown at centrolateral electrodes (C3/C4) across sham (black) and anodal (blue) conditions. The arrow shows the lateralized readiness potential (LRP). Response and feedback locked ERPs from correct (solid) and error (dashed) trials shown at Cz across sham (black) and anodal (blue) conditions. Arrows show the error-related negativity (ERN) and feedback-related negativity (FRN). Fig. 1A adapted from Reinhart and Woodman (2015) with permission from the Proceedings of the National Academy of Sciences, USA. Fig. 1B-C adapted from Reinhart and Woodman (2014) with permission from the Society for Neuroscience.
