Fig. 1.
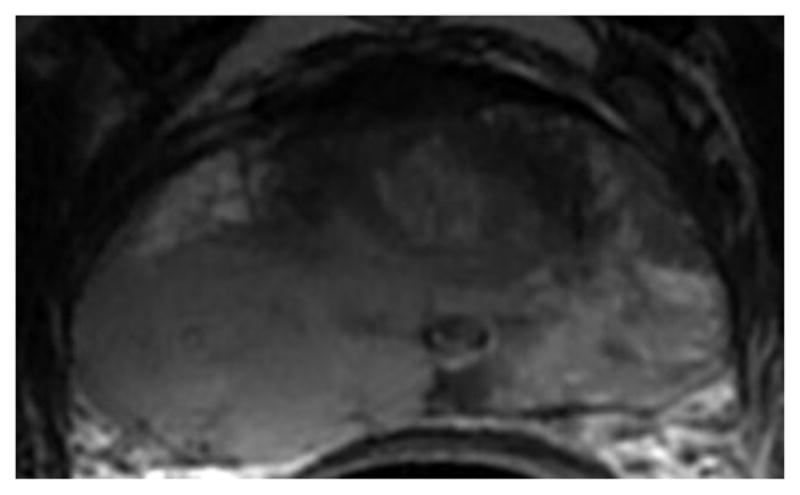
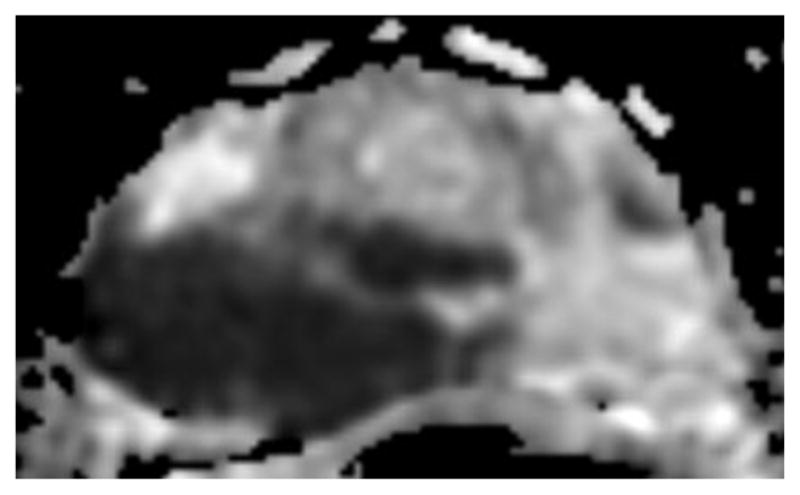
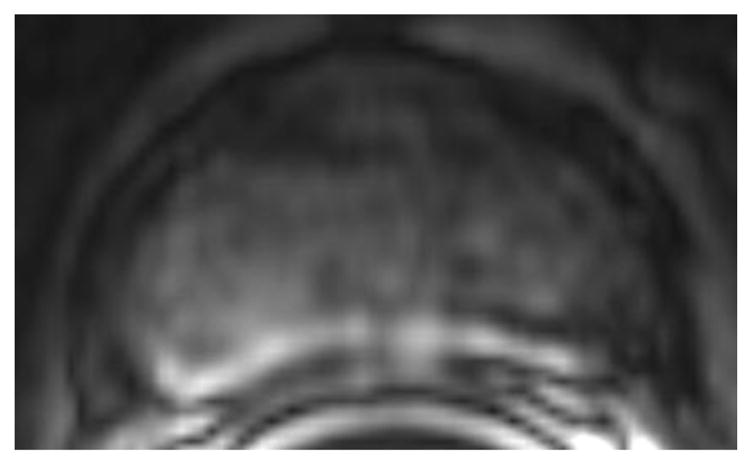
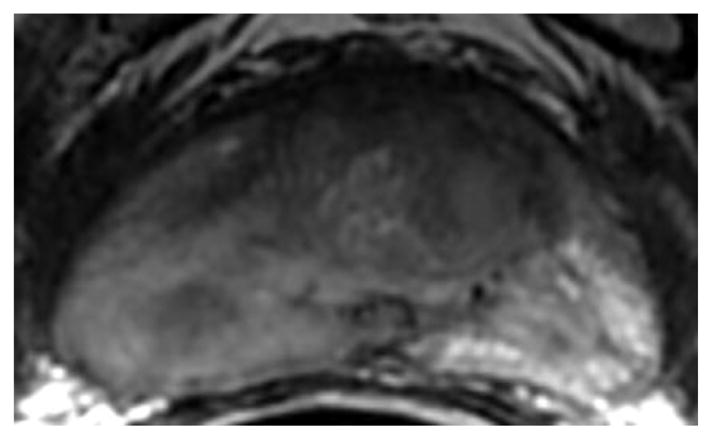
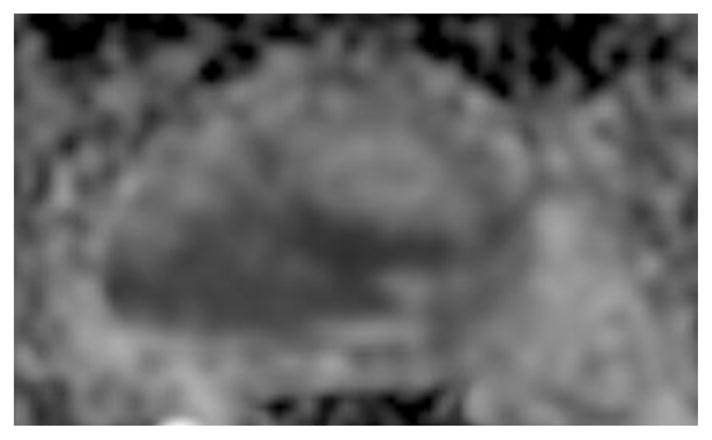
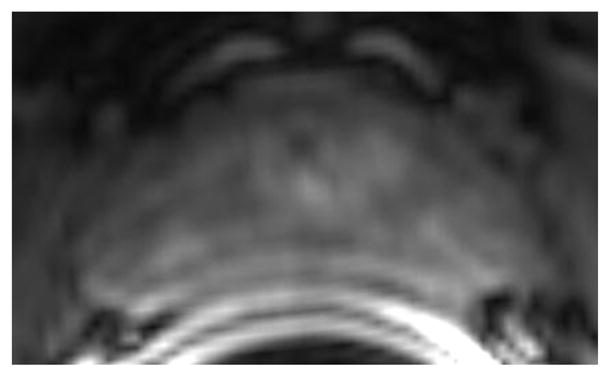
a-f: Sixty-eight-year-old man with histopathologically-proven prostate cancer (Gleason score 4+4) who had MRI examinations before (a-c) and after the start (d-f) of androgen-deprivation therapy: (a/d) T2-weighted images, (b/e) ADC maps (b = 1000 s/mm2), (c/f) T1-weighted dynamic contrast-enhanced MR images.
