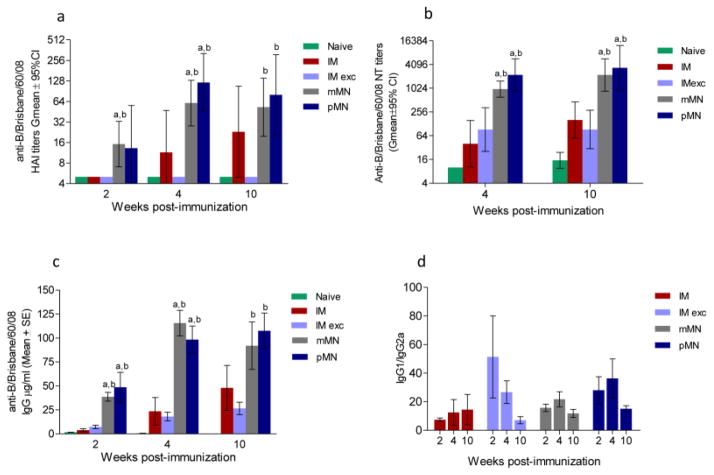
Fig. 4. Humoral immune responses in mice immunized with B/Brisbane/60/08 vaccine.
(a) Anti-B/Brisbane/60/08 HAI titers; (b) Neutralizing antibody titers; (c) Total IgG titers; (d) IgG1 to IgG2a titer ratio. Abbreviations are as listed in the legend for Fig. 3. ELISA antibody data for ratios represent the mean ± SEM, HAI titers and NT represent the geometric mean ± 95%CI. ap ≤ 0.05 mMN or pMN compared to the IM group. bp ≤ 0.05 mMN or pMN compared to the IM exc. group at the same post-immunization time points.

