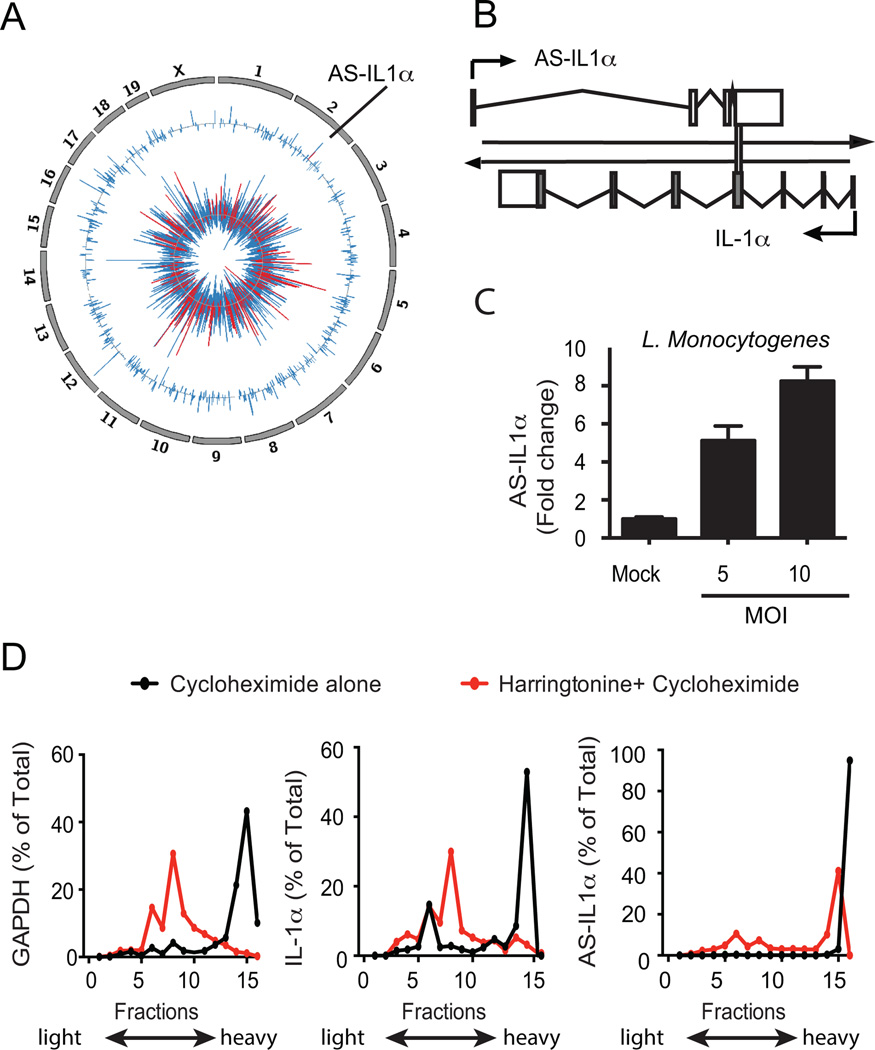
Figure 1.
Identification of AS-IL1α. (A) Circos plot showing differentially expressed genes in splenocytes from L. Monocytogenes infected mice. Chromosomes are indicated on the outer tracks. The middle track shows log2 fold-change values for all lncRNAs and AS-IL1α (colored red). The inner track shows log2 fold-change values for protein-coding genes, with immune genes colored in red. (B) AS-IL1α schematic in murine macrophages. AS-IL1α chromosomal localization overlaps with IL-1α protein coding gene on chromosome 2 indicated by vertical bar. (C) Macrophages infected with L. Monocytogenes for 3 hours at MOI 5 and MOI 10. Data were normalized with GAPDH, fold change calculated and are representative of 2 independent experiments (D) Polysome profiling of GAPDH, IL-1α and AS-IL1α transcripts. Immortalized macrophages were stimulated with LPS and either treated with cycloheximide alone, or harringtonine prior to cycloheximide treatment to determine translational potential of AS-IL1α.

