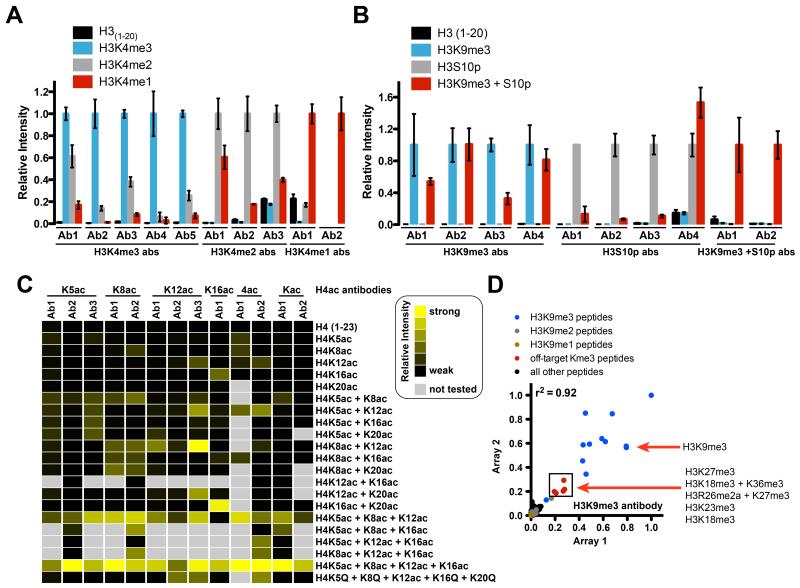
Figure 2. Unfavorable observations of histone PTM antibody behavior.
(A) The inability to distinguish the modification state on a particular residue (e.g., mono-, di-, or trimethyl lysine). H3K4me3 and H3K4me2 antibodies cross-react with H3K4me2 and H3K4me1 peptides, respectively, to varying degrees. Average signal intensities from each antibody screened by microarray were normalized to signal from the target peptide (H3K4me3, left; H3K4me2, middle; H3K4me1, right). Error is presented as ± S.E.M. from at least two arrays. H3K4me3 Ab1 (Millipore 07-473); H3K4me3 Ab2 (Epicypher 13-0004); H3K4me3 Ab3 (Active Motif 39160); H3K4me3 Ab4 (Abcam ab8580); H3K4me3 Ab5 (Abcam ab1012); H3K4me2 Ab1 (Active Motif 39142); H3K4me2 Ab2 (Epicypher 13-0013); H3K4me2 Ab3 (Abcam ab32356); H3K4me1 Ab1 (Abcam ab8895); H3K4me1 Ab2 (Millipore 07-436). (B-C) The influence of neighboring PTMs. (B; Left) Binding of H3K9me3 antibodies to their epitopes is inhibited to varying degrees by neighboring H3S10 phosphorylation (H3S10p) and vise versa. Average signal intensities from each antibody screened by microarray were normalized to signal from the target peptide. Error is presented as ± S.E.M. from at least two arrays. H3K9me3 Ab1 (Millipore 07-442); H3K9me3 Ab2 (Diagenode C15410193); H3K9me3 Ab3 (Active Motif 39161); H3K9me3 Ab4 (Abcam ab8898); H3S10p Ab1 (Active Motif 39253); H3S10p Ab2 (Abcam ab5176); H3S10p Ab3 (Invitrogen 491041); H3S10p Ab4 (Millipore 04-817); H3K9me3 + S10p Ab1 (Millipore 05-809); H3K9me3 + S10p Ab2 (Abcam ab5819). (C) H4 acetyl antibodies prefer poly-acetylated epitopes. Results of at least two arrays are presented as heat maps of normalized mean intensities on a scale from 0 (black; undetectable binding) to 1 (yellow; strong binding). K5ac Ab1 (Active Motif 39169); K5ac Ab2 (Active Motif 39170); K5ac Ab3 (Millipore 07-327); K8ac Ab1 (Active Motif 39172); K8ac Ab2 (Epicypher 130021); K12ac Ab1 (Active Motif 39165); K12ac Ab2 (Millipore 04-119); K12ac Ab3 (Millipore 07-595); K16ac Ab1 (Active Motif 39168); 4ac Ab1 (Active Motif 39179); 4ac Ab2 (Millipore 05-1355); Kac Ab1 (Active Motif 39925); Kac Ab2 (Millipore 06866). (D) Off-target recognition. Scatter plot showing two arrays probed with an H3K9me3 antibody (Diagenode C15410193). Analysis of H3K9 methylation states shows strong binding to H3K9me3 peptides (blue), and minimal binding to H3K9me1 (yellow) and H3K9me2 (grey) peptides. This antibody also binds off-target Kme3 peptides (red). All other peptides are shown in black. Coefficient of determination (r2) was calculated by linear regression analysis using GraphPad Prism v5.

