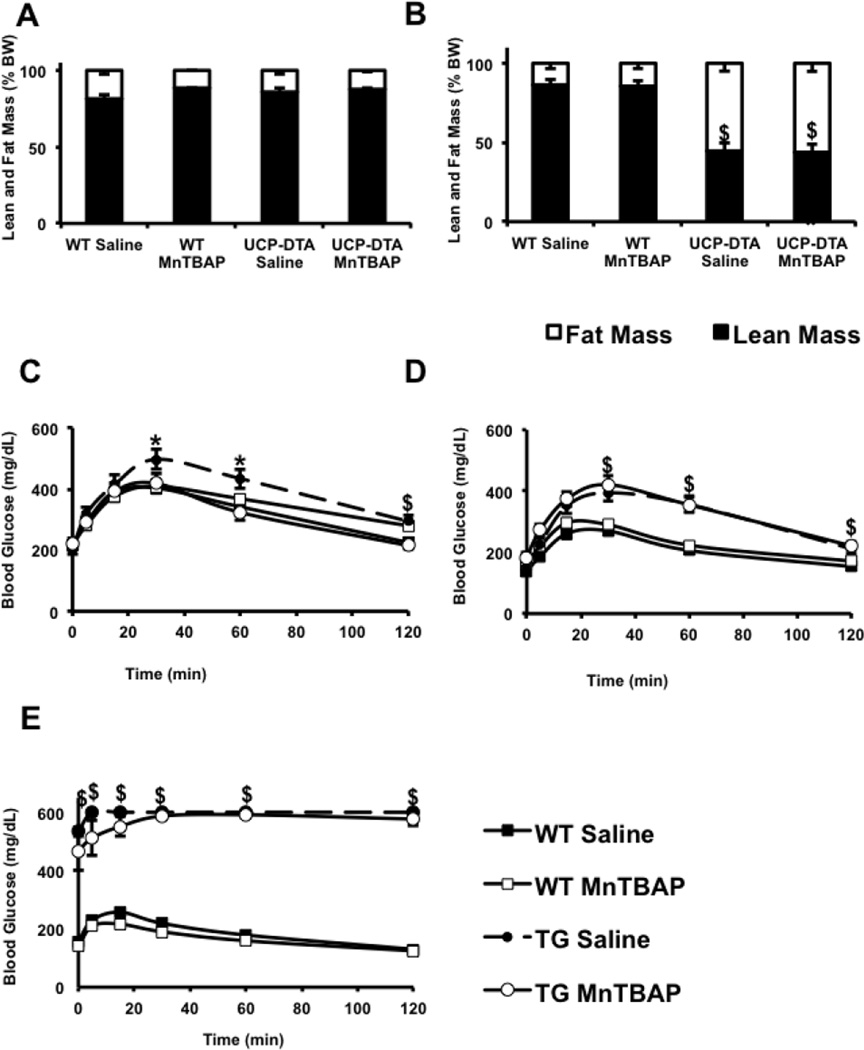
Figure 1. Impact of MnTBAP on body composition and glucose tolerance in UCP-DTA and db/db mice.
A, B. Relative distribution of fat and lean mass as measured by DEXA in 13 and 24 week-old UCP-DTA mice vs. controls, respectively. Lean and fat mass is expressed as % of total body mass (n=3–9). C–E. Glucose tolerance tests in 13 week-old UCP-DTA, 24 week-old UCP-DTA, and 9 week-old db/db mice, respectively (n=6–15). Mice were treated with MnTBAP or saline, as indicated. Maximum glucose concentration detectable by the glucometer is 600mg/dl. *p<0.05 vs. other genotypes; $ p<0.05 vs. WT saline and WT MnTBAP.

