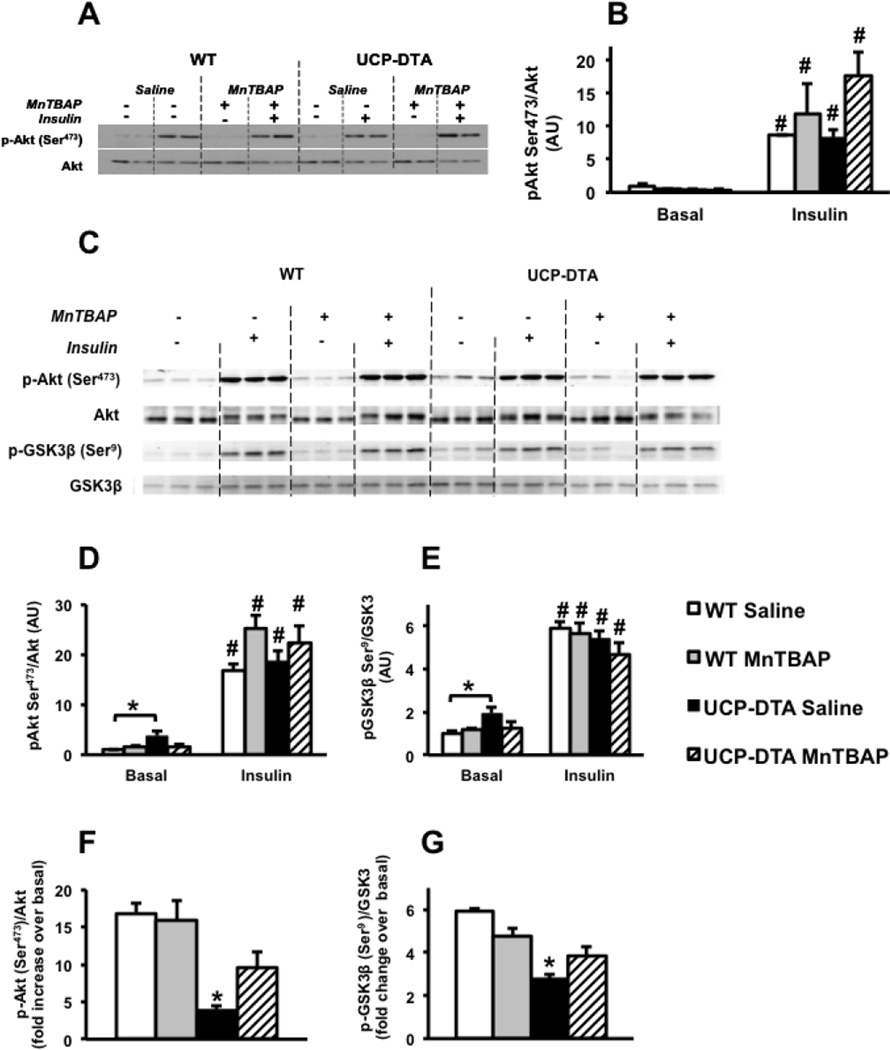
Figure 7. Insulin signaling in hearts of 13 or 24 week-old UCP-DTA and control mice treated with saline or MnTBAP.
A, B. Western blots and densitometric analysis representing phosphorylation of Akt in 13 week-old UCP-DTA and control hearts perfused with or without 1nM insulin (n=4). C–E. Western blots and densitometric analysis representing phosphorylation of Akt and GSK3 in 24 week-old UCP-DTA and control hearts with or without 1nM insulin. E, F. Fold increase of insulin stimulated phospho-Akt and GSK3 over basal (n=5). *p<0.05 vs. other genotypes in the same groups; # p<0.05 for insulin- stimulated vs. basal state for same genotype.
 Saline-treated control wildtype (WT) mice,
  MnTBAP-treated WT mice,
  UCP-DTA treated with saline,
  UCP-DTA treated with MnTBAP.

