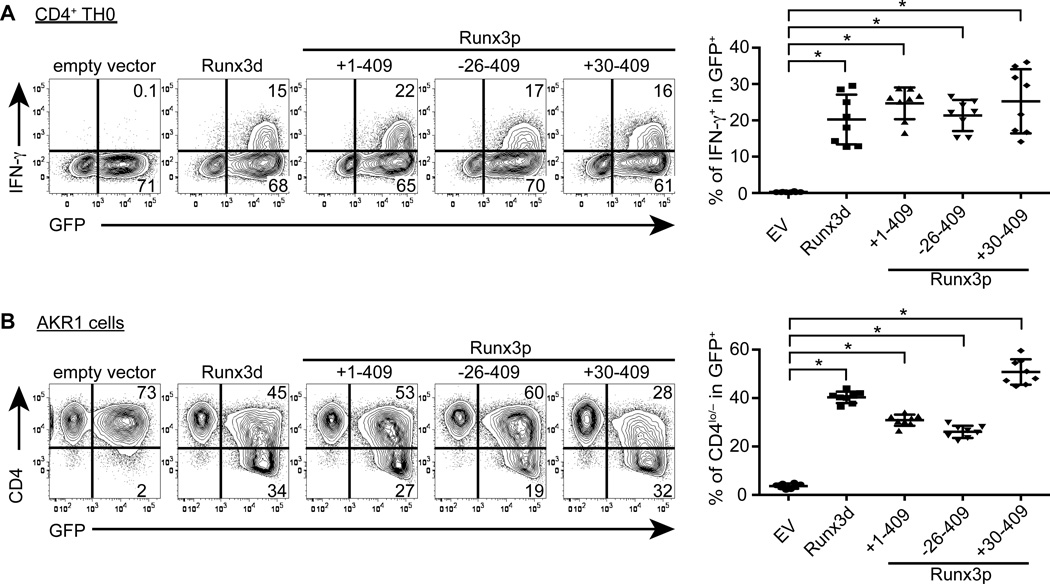
Figure 4. Alternatively initiated Runx3 isoforms are functionally intact.
(A) Intracellular staining for IFN-γ in CD4+ T cells transduced with retrovirus expressing each Runx3 isoform after 6 days of culture under neutral conditions. Percentages of GFP+ IFN-γ+ and GFP+ IFN-γ− cells in viable cells, as determined by LIVE/DEAD Aqua staining are shown in representative plots from two independent experiments with more than two biological replicates each. Statistical analysis of percentages of IFN-γ+ cells in GFP+ cells is shown in the right panel with mean and SD. (B) Surface CD4 staining of the AKR1 thymoma cell line transduced with retrovirus expressing each Runx3 isoform at 72 hours after infection. Percentages of GFP+ CD4+ and GFP+ CD4lo/− cells in DAPI-negative viable cells are shown in representative plots from two independent experiments. Statistical analysis of percentages of CD4lo/− cells in GFP+ cells is shown on the right panel with mean and SD. *P < 0.0001.

