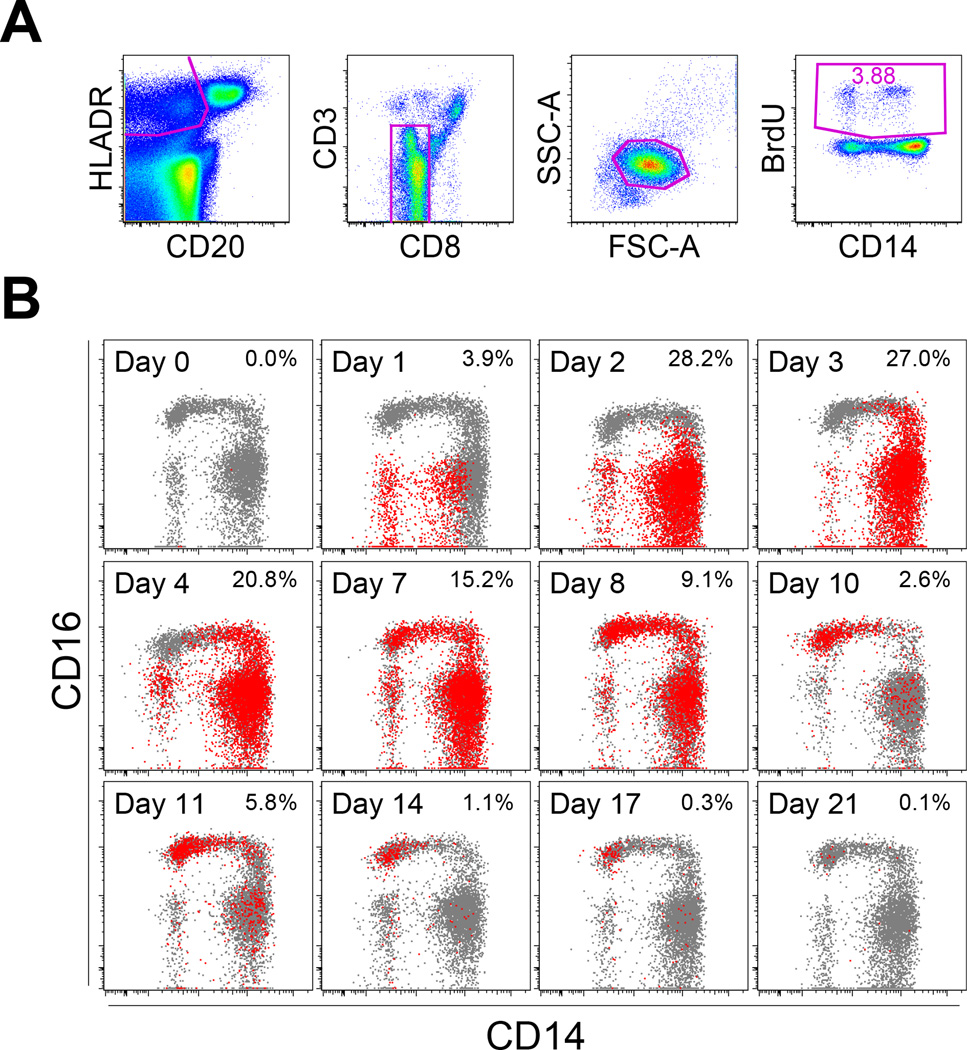
Figure 5. Kinetics of BrdU incorporation by monocyte and DC populations.
Normal healthy rhesus macaques were injected with BrdU intravenously at a dose of 60 mg/kg body weight. EDTA-treated blood was collected at varying time intervals as indicated. The data shown are representative for four animals. (A) BrdU incorporation within the HLA-DR+CD3−CD20−CD8− cell population was examined by immunostaining and flow cytometry. Since monocytes and DC displayed slightly distinct scatter plots, the cell population first was gated on HLA-DR, CD20, CD3, and CD8, and then the scatter plot was confirmed. (B) BrdU-staining cells, as identified in Panel A, were indicated here in red with the percent of HLA-DR+CD3−CD20−CD8− cells noted on the top right corner of each time point after BrdU injection, and results were overlaid onto plots of cells stained for CD14 and CD16 expression shown in gray.

