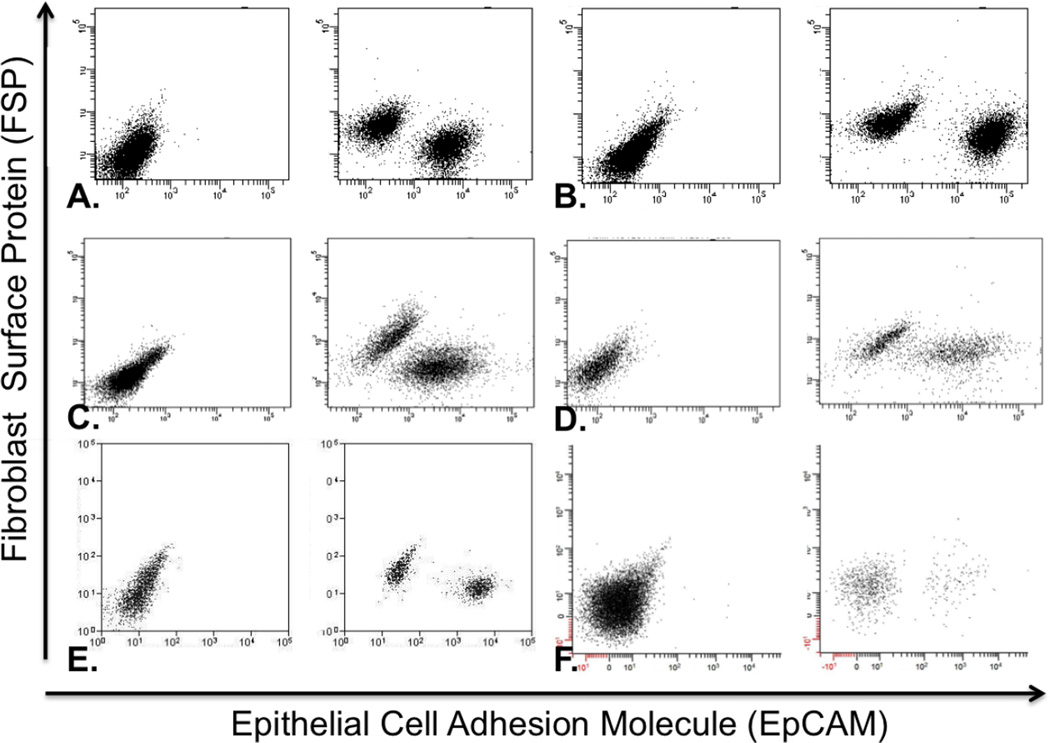
Figure 5.
FACS plots of each established cell line when mixed with an equal number of TAFs and separated. The unstained plot is shown on the left and the stained plot is shown on the right. Cells expressing the EpCAM marker shift to the right along the X-axis, whereas cells expressing the FSP marker shift up along the Y-axis. Cell lines with their corresponding TAFs are A) UM-SCC-105; B) UM-SCC-106; C) UM-SCC-108; D) UM-SCC-109; E) UM-SCC-110; F) UM-SCC-111.

