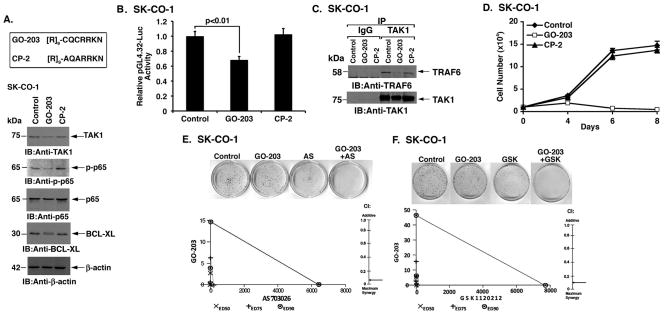
Figure 5. Targeting MUC1-C with GO-203 suppresses TAK1→NF-κB signaling.
A. D-amino acid sequences of the GO-203 and CP-2 peptides (upper panel). SK-CO-1 cells were left untreated or treated with 2.5 μM GO-203 or CP-2 each day for 48 h. Lysates were immunoblotted with the indicated antibodies (lower panels). B. SK-CO-1 cells were transfected with pGL4.32-Luc, treated with 2.5 μM GO-203 or CP-2 each day for 48 h and then assayed for luciferase activity. The results are expressed as the relative luciferase activity (mean±SD of three determinations) compared to that obtained with control untreated cells. C. Lysates from SK-CO-1 cells left untreated or treated with 2.5 μM GO-203 or CP-2 each day for 24 h were precipitated with anti-TAK1. The precipitates were immunoblotted with the indicated antibodies. D. SK-CO-1 cells were left untreated (solid diamonds) and treated with 2.5 μM GO-203 (open squares) or CP-2 (solid triangles) each day for the indicated days. Viable cell number (mean±SD of three replicates) was determined by trypan blue staining. E. SK-CO-1 cells were seeded at 100 cells/well in 6-well plates and left untreated (Control) or treated each day with 0.61 μM GO-203 alone, 1.17 μM AS703026 alone on day 0, or the GO-203/AS703026 combination for 3 d. Colonies were stained with crystal violet on day 14 after treatment (upper panel). SK-CO-1 cells were treated with (i) fixed IC50 ratios of GO-203 alone on days 0, 1, 2 and 3, (ii) fixed IC50 ratios of AS703026 alone on day 0, and (iii) the GO-203/AS703026 combination for 4 d. The multiple effect isobologram analyses on day 4 are shown for the ED50 (X), ED75 (+) and ED90 (o) values (lower left panel). The combination index (CI) is indicated with the arrow (lower right panel). F. SK-CO-1 cells were seeded at 100 cells/well in 6-well plates and left untreated (Control) or treated each day with 1.22 μM GO-203 alone, 9.63 nM GSK1120212 alone on day 0, or the GO-203/GSK1120212 combination for 3 d. Colonies were stained with crystal violet on day 14 after treatment (upper panel). SK-CO-1 cells were treated with (i) fixed IC50 ratios of GO-203 alone on days 0, 1, 2 and 3, (ii) fixed IC50 ratios of GSK1120212 alone on day 0, and (iii) the GO-203/GSK1120212 combination for 4 d. The multiple effect isobologram analyses on day 4 are shown for the ED50 (X), ED75 (+) and ED90 (o) values (lower left panel). The combination index (CI) is indicated with the arrow (lower right panel). CI values are included in Supplemental Table S2.

