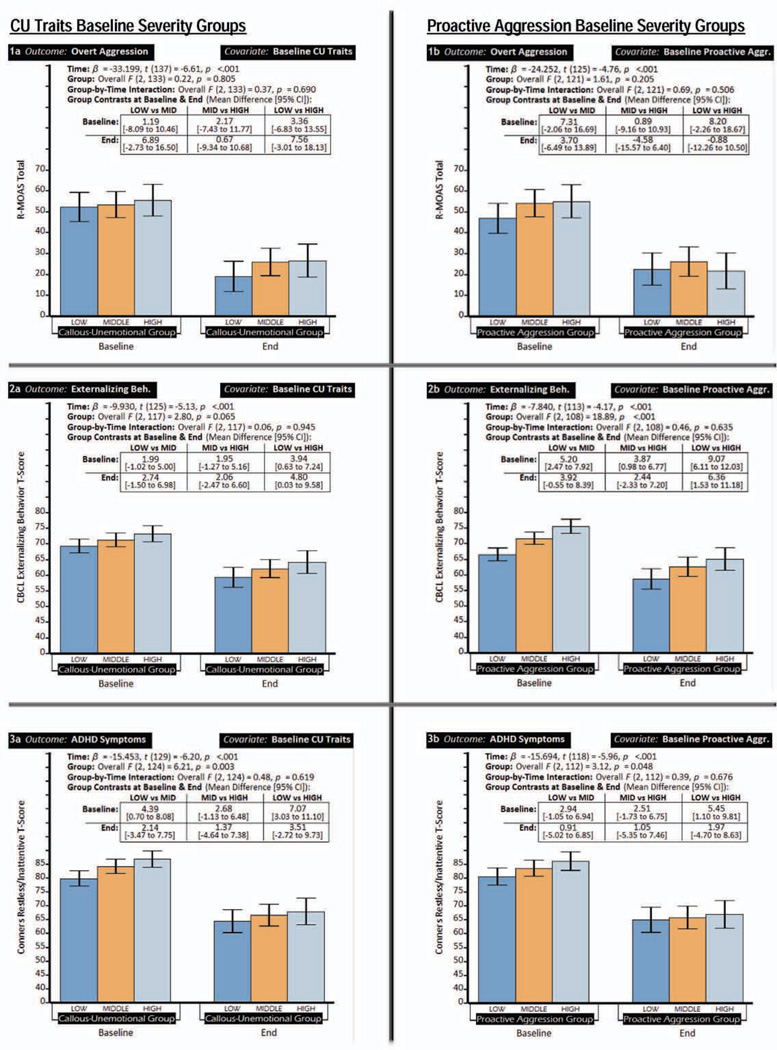
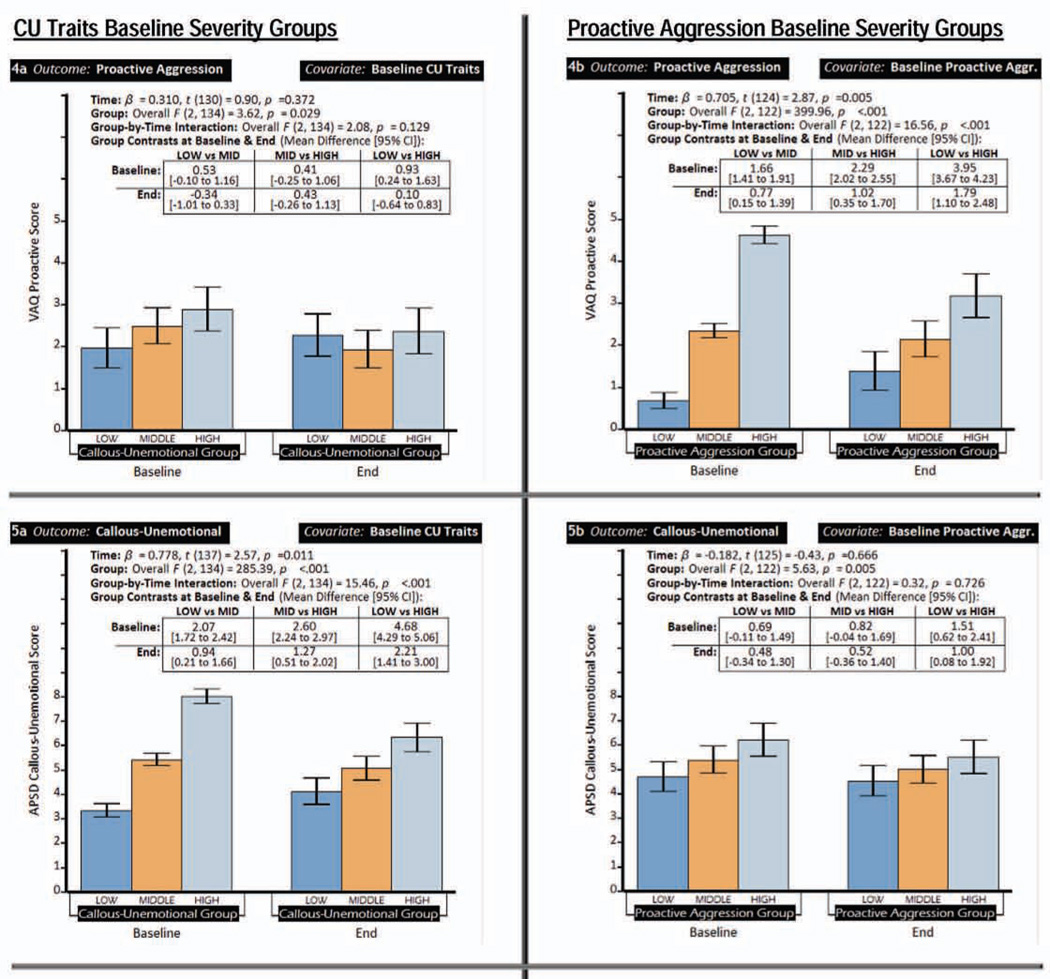
Figure 2.
Behavioral outcomes for groups with low, middle, and high scores at baseline on proactive aggression and callous-unemotional traits. Note: Each row shows associations between one behavioral outcome and baseline severity groups (low, middle, high) of proactive aggression and callous-nemotional traits. Panels on the left show behavioral outcomes with participants stratified by proactive aggression group. Panels on the right show callous-unemotional traits groups. The table within each chart shows the contrasts between the 3 severity groups (the differences in least-squares means and the 95% CI for that difference) at baseline and at the end of the stimulant monotherapy protocol. APSD C-U = Antisocial Process Screening Device Callous-Unemotional scale; CBCL = Child Behavior Checklist; ConnGI-P = Conners Global Index (Parent Version); R-MOAS = Retrospective-Modified Overt Aggression Scale; VAQ = Vitiello Aggression Scale.


