
Figure 2.
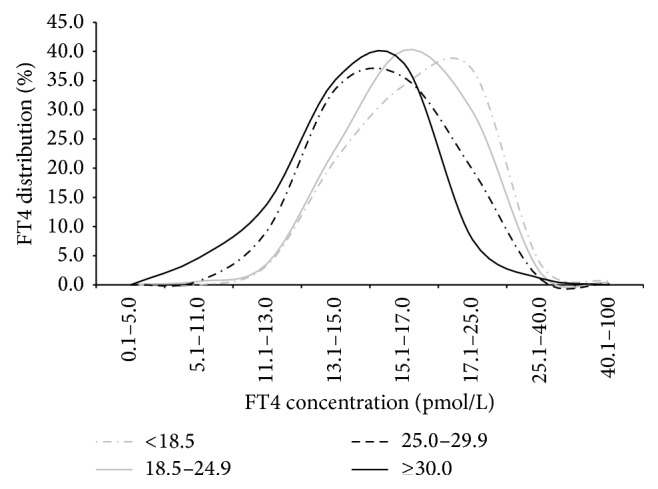
Distribution of FT4 in different group in pregnant women. In comparison to normal and underweight groups, obese and overweight groups resulted with left-shifted FT4 distribution curves; hence, the FT4 level was lower in groups with higher BMI.