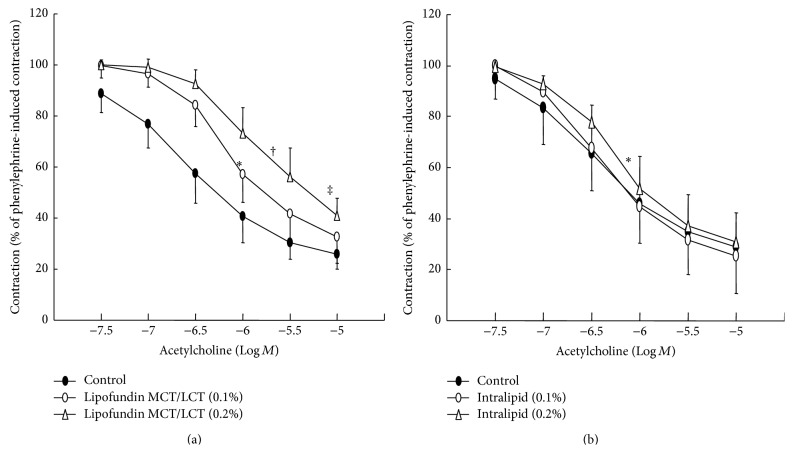
Figure 1.
Effect of lipid emulsion (Lipofundin MCT/LCT ((a), N = 7) and Intralipid ((b), N = 7)) on the acetylcholine concentration-response curves in the endothelium-intact aorta. Data are the mean ± SD and are expressed as the percentage of maximal precontraction induced by 3 × 10⁻⁷ M phenylephrine. N indicates the number of rats from which descending thoracic aortic rings were derived. ED50: ∗ P < 0.05 and † P < 0.01 versus control. Maximal relaxation: ‡ P < 0.01 versus control.

