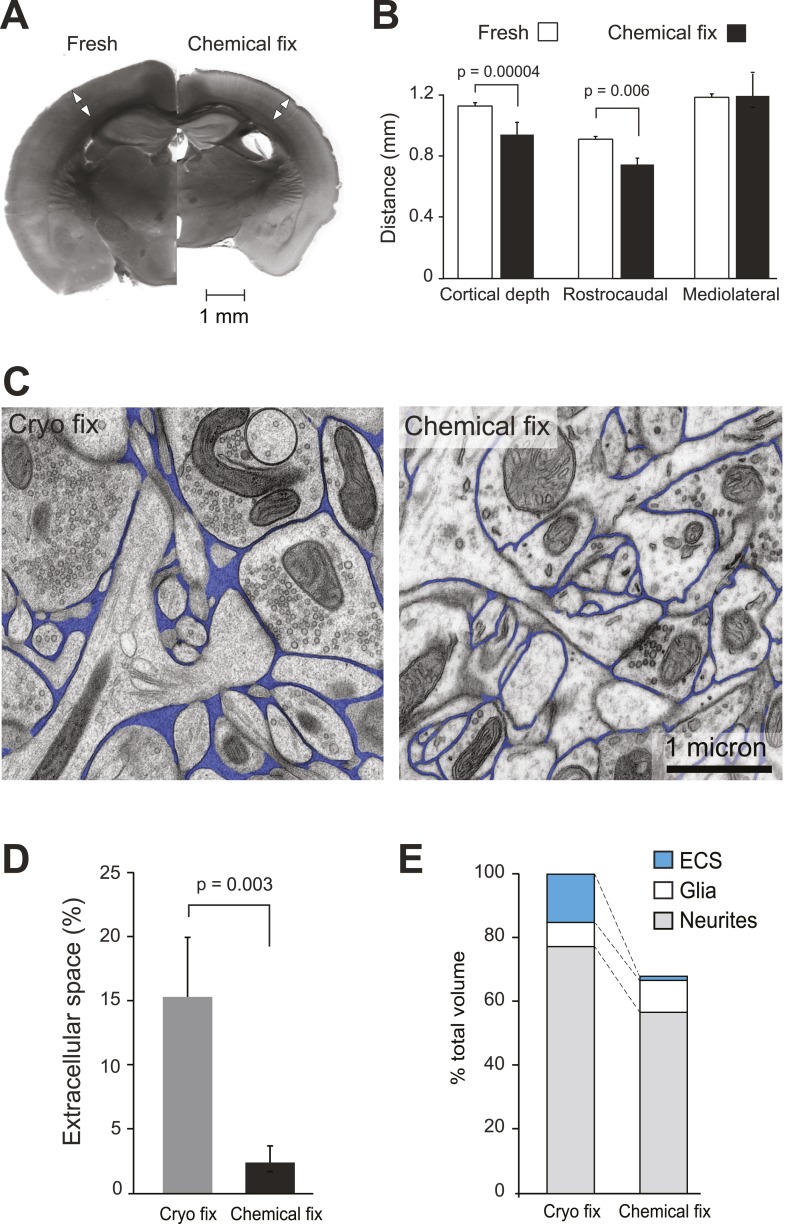
Figure 1. Chemical fixation reduces cortical volume and extracellular space.
(A) Coronal sections of fresh (left) and chemically fixed (right) adult mouse brains. Double-headed arrows overlaying the somatosensory cortex of each section show the position at which the cortical thickness was measured. (B) Measurements of cortical thickness show a 16% reduction after chemical fixation (p = 0.00004, unpaired Student's t-test, left). Measurements across tangential sections show 18% shrinkage in the rostrocaudal axis (p = 0.006, one way ANOVA), but not in the mediolateral axis (p = 0.942, one way ANOVA, right). (C) TEM of cryo fixed (left) and chemically fixed (right) neuropil from the adult mouse cerebral cortex show reduction in the extracellular space (pseudo-coloured in blue) after chemical fixation. (D) Measurements of the volume fraction of extracellular space from serial section analysis showed a six-fold difference between the two fixation techniques (p = 0.003, one way ANOVA). (E) Measurements of volumes occupied by extracellular space, neurites, and glia, from serial section transmission electron microscopy sections showed how the different compartments are altered by chemical fixation. Volume occupied by astrocytic processes was significantly increased after chemical fixation (p = 0.01, one way ANOVA). However, there was no change in the volume occupied by axons and dendrites (p = 0.074, one way ANOVA). As the volume of the cortex is reduced by 31% after chemical fixation, these percentages are shown in the bar chart in which the total volume of chemically fixed neuropil is 69% of the cryo-fixed value (100%).
DOI: http://dx.doi.org/10.7554/eLife.05793.003


