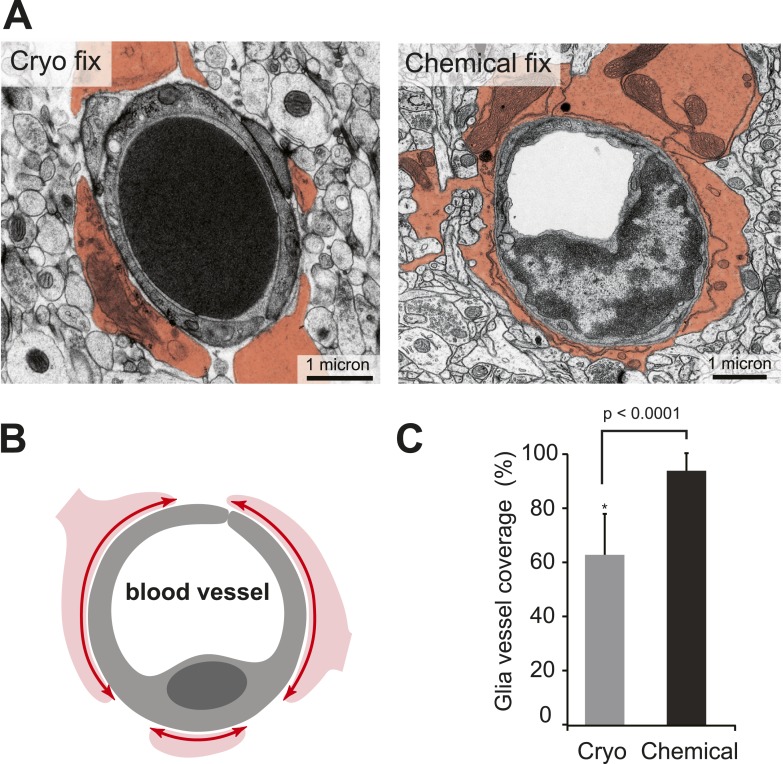
Figure 3. Cryo-fixed capillaries show less astrocytic coverage.
(A) Electron micrographs of transversely sectioned capillaries show the astrocytic endfeet pseudo-coloured in orange. Cryo-fixed example shows a darkly stained erythrocyte within the vessel lumen. (B) Schematic diagram indicates the coverage measured. (C) Chemically fixed tissue contains capillaries with more glial coverage (p < 0.0001, n = 11 vessels cryo, n = 69 vessels perfused, unpaired Student's t-test).
DOI: http://dx.doi.org/10.7554/eLife.05793.009

