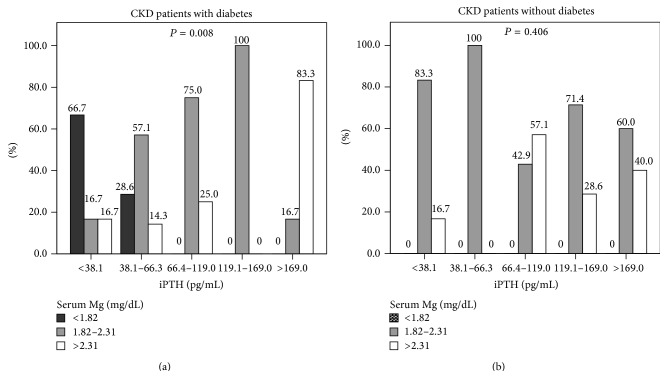
Figure 1.
Correlation between serum Mg levels and iPTH levels. (a) CKD patients with diabetes. (b) CKD patients without diabetes. Comparisons of categorical data between two groups were analyzed by Chi-square test. When cells have expected count less than 5, data were analyzed by Fisher's Exact test. Data are presented as percentage (%). A P value less than 0.05 was considered statistically significant.

