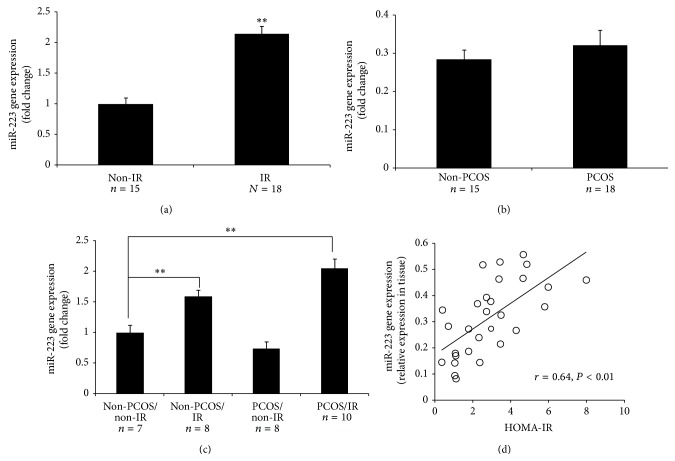
Figure 1.
miR-223 expression in human AT. (a) Depicted is comparison of the levels of miR-223 expression in the AT of women with and without IR; miR-223 was significantly overexpressed in the IR group. (b) Depicted is comparison of the levels of miR-223 expression in the AT of women with and without PCOS; the expression of miR-223 did not differ between two groups. (c) Depicted is comparison of the levels of miR-223 expression in the AT of women: (A) without PCOS or IR, (B) without PCOS (non-PCOS), but with IR, (C) with PCOS and IR, and (D) with PCOS, but without IR; the expression of miR-223 was significantly higher in the AT in women with IR. ∗∗ P < 0.01 comparing tissues from women with or without PCOS and with IR versus that of women without PCOS or IR. (d) Depicted is the association between miR-223 expression and HOMA-IR. (Two group comparisons, (a) and (b), were carried out by unpaired Student's t-test; comparison of (d) was carried out by ANOVA followed by a posttest by using the Fisher (among groups) and Dunnett (compared to control group) test.)

