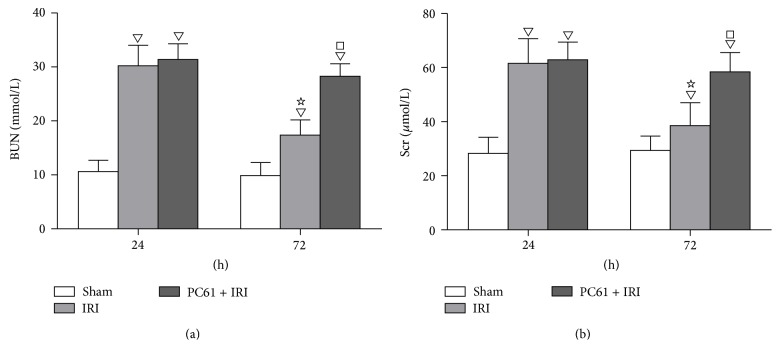
Figure 1.
BUN and Scr levels at 24 h and 72 h after reperfusion. (a) Concentrations of BUN. (b) Concentrations of Scr. Values of the bar graphs represent the mean ± SD (n = 8 per group). Compared with the Sham group, ▽ P < 0.05; compared with the IRI group at 24 h after reperfusion, ☆ P < 0.05; compared with the IRI group at 72 h after reperfusion, □ P < 0.05.

