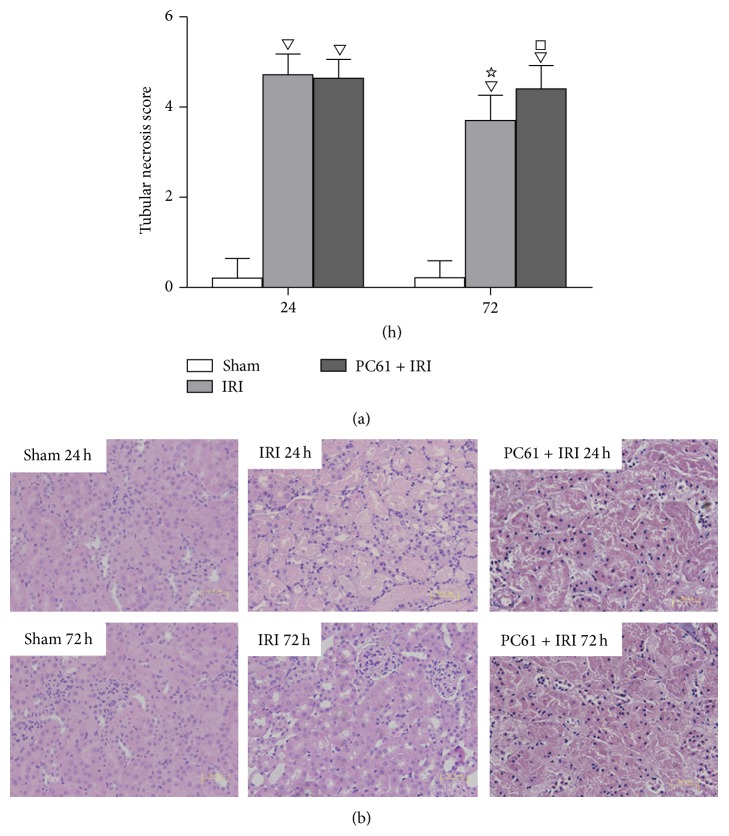
Figure 2.
Renal histology at 24 h and 72 h after reperfusion. (a) Tubular necrosis scores in each group. Values of the bar graphs represent the mean ± SD (n = 8 per group). Compared with the Sham group, ▽ P < 0.05; compared with the IRI group at 24 h after reperfusion, ☆ P < 0.05; compared with the IRI group at 72 h after reperfusion, □ P < 0.05. (b) Representative histology images of H&E stained renal sections at 24 h and 72 h after reperfusion (original magnification: ×400, scale bar: 50 μm). After IRI, a large number of tubular epithelial cells swelled with vacuolar degeneration, parts of the cells shrunk and had dark nuclei, parts of the cells lost intracellular structure due to cellular necrosis and abscission, and cellular debris and casts were seen in the enlarged lumen.

