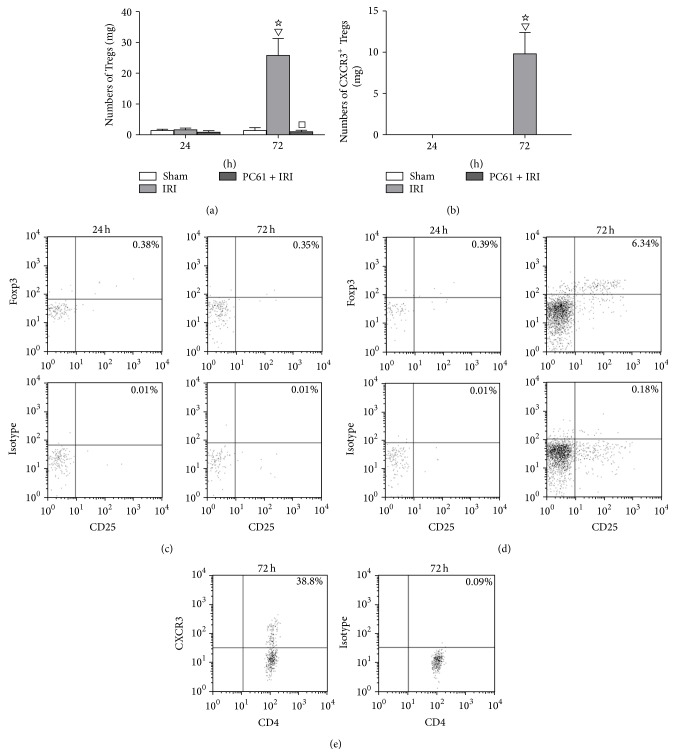
Figure 3.
Numbers of Tregs and CXCR3+ Tregs in kidney at 24 h and 72 h after reperfusion measured by flow cytometry analysis. (a) Numbers of CD4+CD25+Foxp3+ Tregs in kidney at 24 h and 72 h after reperfusion. (b) Numbers of CXCR3+CD4+CD25+Foxp3+ Tregs in kidney at 24 h and 72 h after reperfusion. Values of the bar graphs represent the mean ± SD (n = 8 per group). Compared with the Sham group, ▽ P < 0.05; compared with the IRI group at 24 h after reperfusion, ☆ P < 0.05; compared with the IRI group at 24 h or 72 h after reperfusion, □ P < 0.05. (c) Representative dot plots of Tregs in kidney from Sham group at 24 h and 72 h after reperfusion. (d) Representative dot plots of Tregs in kidney from IRI group at 24 h and 72 h after reperfusion. The CD4+ T cells were initially gated from the lymphocyte area by forward scatter (FSC) versus side scatter (SSC), and then the expression of CD25 and Foxp3 was analyzed in this population. The percentage of CD4+CD25+Foxp3+ Tregs in CD4+ cells was obtained in the upper right quadrant. (e) Representative dot plots of CXCR3+ Tregs from the IRI group. Because there were no CXCR3+ Tregs detected in the kidney from the Sham or IRI group at 24 h after IRI, only dot plots from the IRI group at 72 h after reperfusion were shown. The percentage of CXCR3 in the CD4+CD25+Foxp3+ population was shown in the upper right quadrant.

