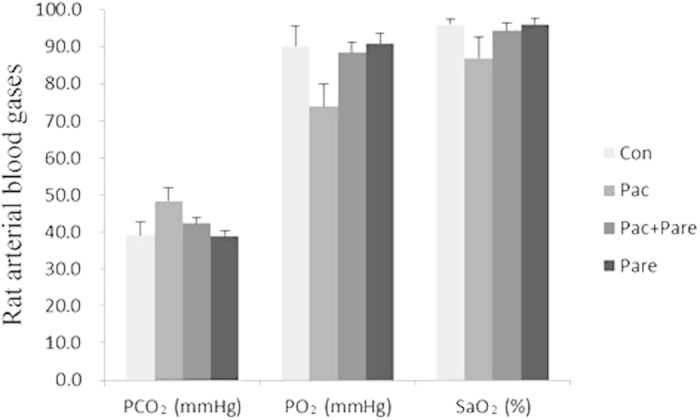
Figure 1. The effect of different treatments on rat arterial blood gas values.

The PCO2 of the Pac group was significantly higher compared with the Con group, while PO2 and SaO2 levels significantly decreased, p < 0.01; there were no significant differences among the Con group, the Pac + Pare group, and the Pare group in the three indicators. The data are presented as x ± s.
