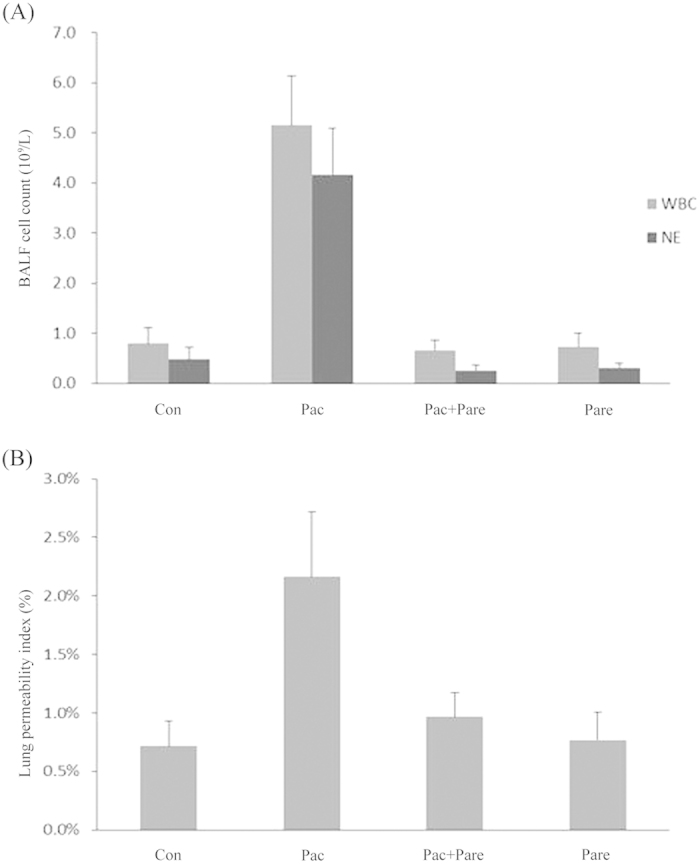
Figure 3.

(A) White blood cell (WBC) and neutrophils (NE) counts in BALF: the total number of WBCs was sharply increased in the Pac group, which was dominated by NEs. In other three groups, there were fewer cells, and NE occupied a smaller percentage; p < 0.01. The data were presented as x ± s; (B) The lung permeability index (LPI, BALF protein/serum protein) change for the four different groups: the LPI was significantly increased in the Pac group (2.2 ± 0.56%) compared with the Con group (0.72 ± 0.22%), the Pac + Pare group (0.97 ± 0.21%), and the Pare group (0.77 ± 0.24%), p < 0.01. The data are presented as x ± s.
