Figure 4.
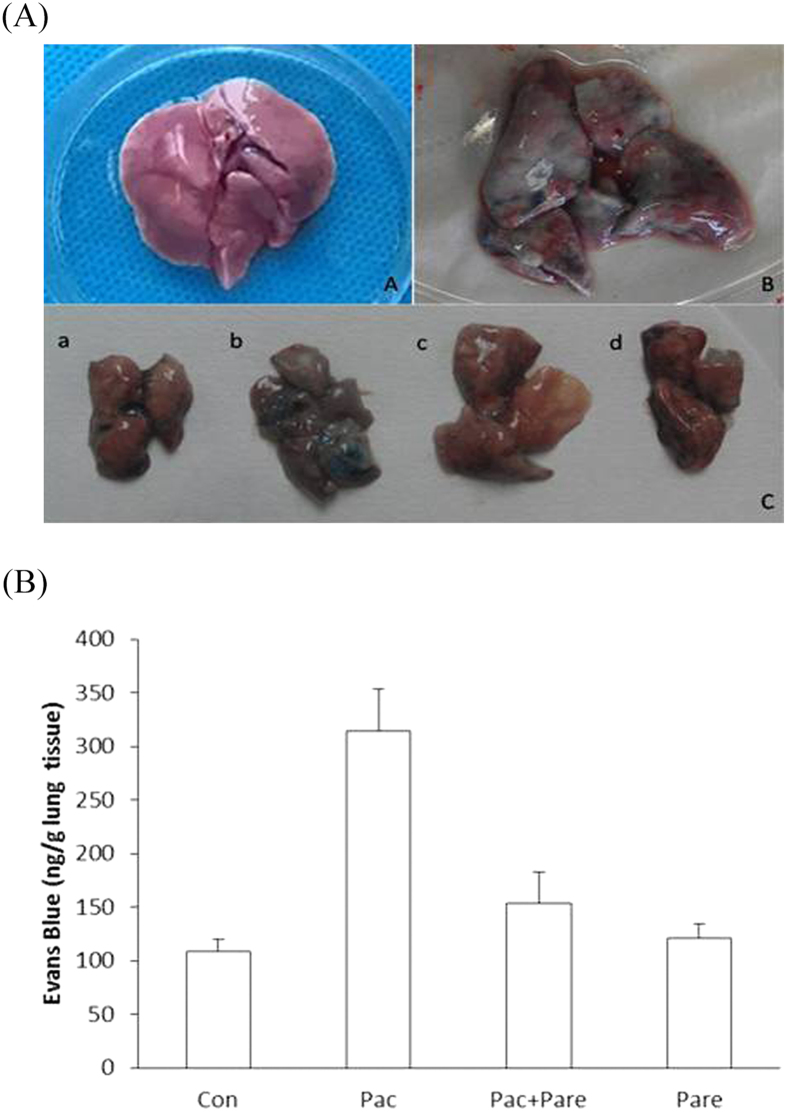
(A) Normal lung and lung tissue stained with Evans Blue: A. Normal lung tissue; B. Pac group lung stained with Evans blue; C. a, b, c, d were lung tissues collected from the Con, Pac, Pac + Pare, and Pare group of rats, respectively, 30 min after Evans blue iv.; (B) Content of Evans blue per gram of lung tissue: evans blue in the Con group was 108 ± 12.1 ng/g and 314 ± 38.7 ng/g in the Pac group, p < 0.01; there were no significant differences among the Con group, the Pac + Pare group (154 ± 28.6 ng/g), and the Pare group (120 ± 13.5 ng/g). The data are presented as x ± s.

