
FIG. 4.
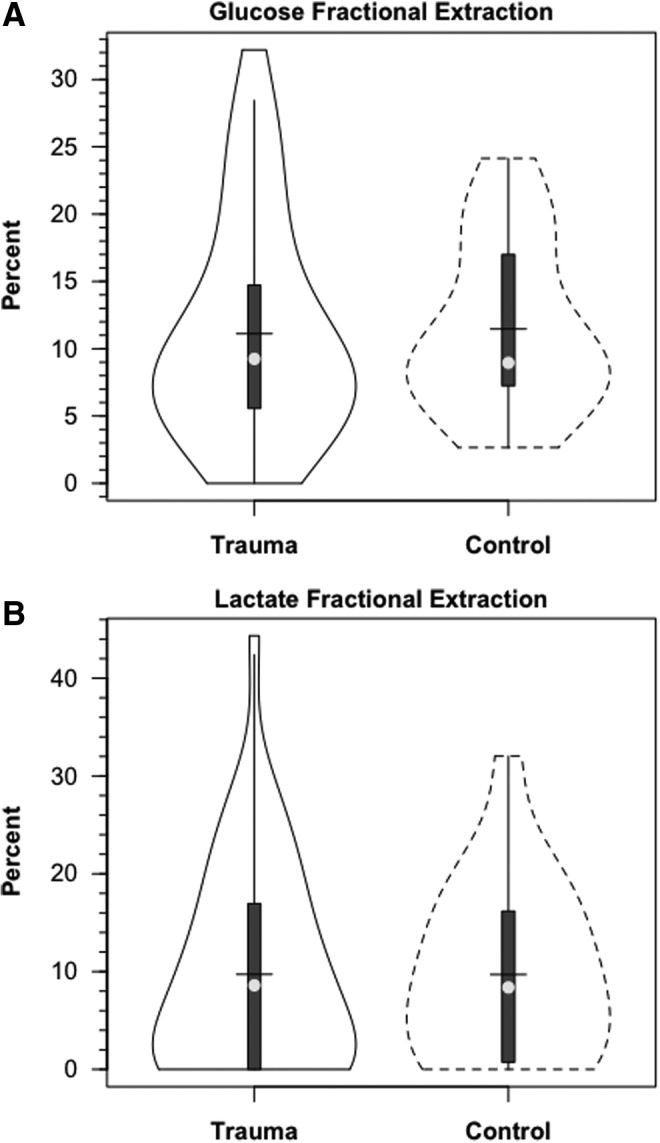
Violin plots of cerebral glucose (A) and lactate (B) fractional extraction in healthy control subjects and traumatic brain injury (TBI) patients. Solid lines represent TBI patients (n=12) whereas dashed lines are normal control subjects (n=6).