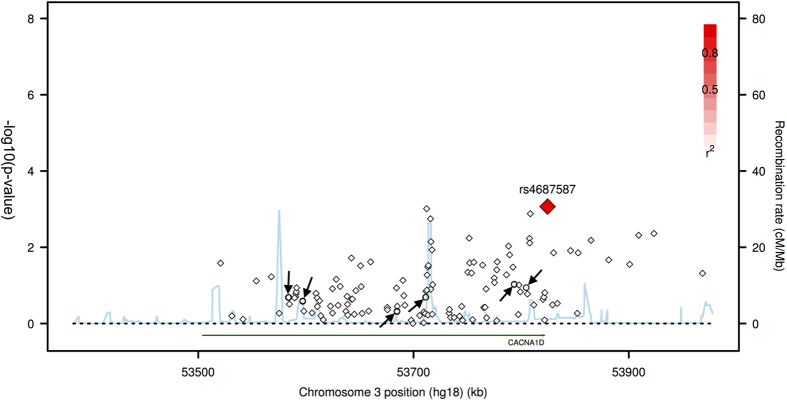
Figure 1. Regional association plot for both imputed and genotyped SNPs in HapMap CHB.

This plot shows association results of imputed and genotyped SNPs within CACNA1D gene in Han Chinese cohort. The diamonds represent the imputed SNPs, and the circles represent the genotyped SNPs (marked by arrow), which are rs709323, rs3774458, rs1460118, rs3774530, rs3774601 and rs3774605 from left to right in order. The horizontal axis is the genomic context of the region studied (along with the genes). The left vertical axis represents negative logarithm of p-value and the right vertical axis is the recombination frequency of the region. Red diamond shows an imputed SNP, rs4687587, which has minimum p-value.
