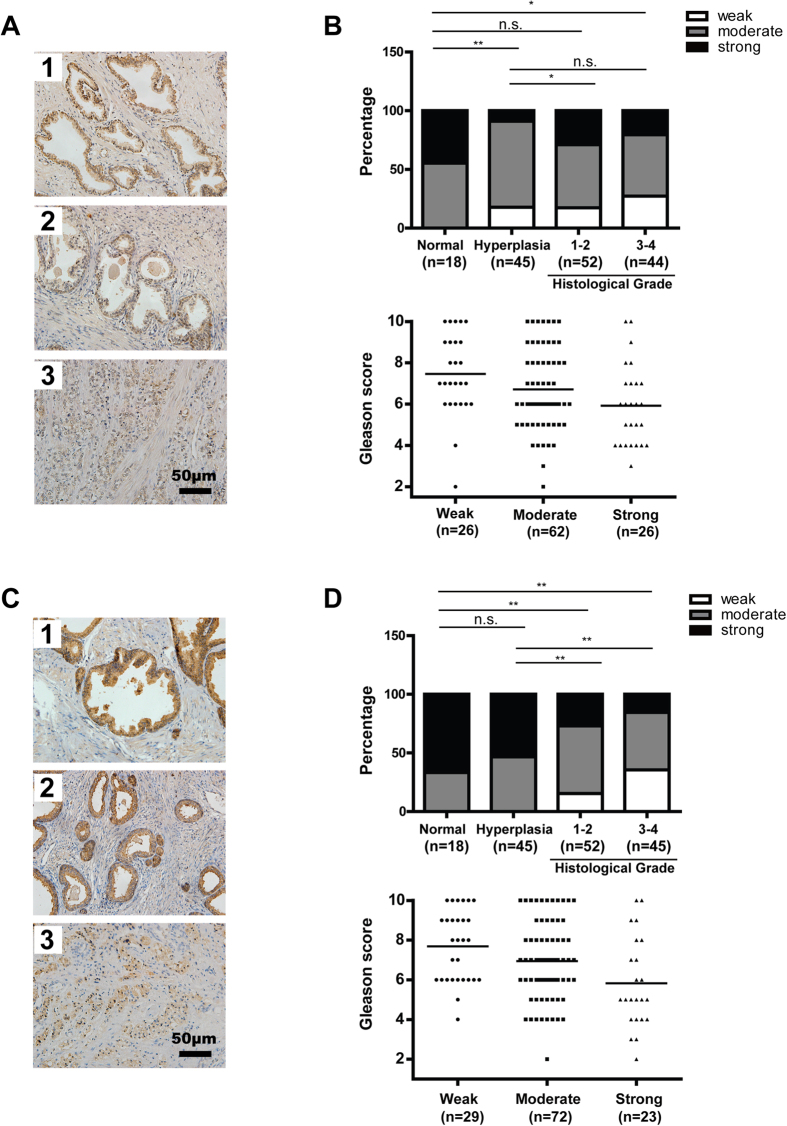
Figure 1. Decreased expression of STIM1 and ORAI1 in human prostate cancer tissues when compared with normal tissues.
A. Representative immunohistochemical staining of STIM1 (brown) in normal prostate tissue (1), hyperplasia tissue (2) and prostate tumor tissue with a Gleason score of 10 (3). B. Upper panel: The expression pattern of STIM1 in normal, hyperplasia and prostate tumor tissues with different histological grades. Low panel: The Gleason score of human prostate cancer tissues with different expression levels of STIM1. The mean value of Gleason score in each group was indicated by horizontal line. C. Representative immunohistochemistry staining of ORAI1 (brown) in normal prostate tissue (1), hyperplasia tissue (2) and prostate tumor tissues with a Gleason score of 10 (3). D. Upper panel: The expression pattern of ORAI1 in normal, hyperplasia and prostate tumor tissues with different histological grades. Low panel: The Gleason score of human prostate cancer tissues with different expression levels of ORAI1. The mean value of Gleason score in each group was indicated by horizontal line.

